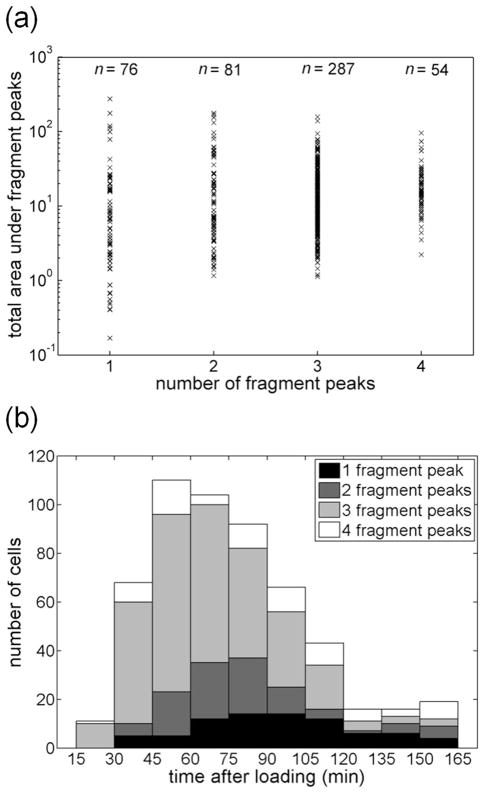
Figure 4.
Distributions of cells with respect to total peak area (peptide loading), fragment peak number, and analysis time. (a) The distribution of total fragment peak area as a function of number of fragment peaks. (b) Histogram of the population distribution as a function of time elapsed after peptide loading. For both panels, n = 498 drug-treated cells.

