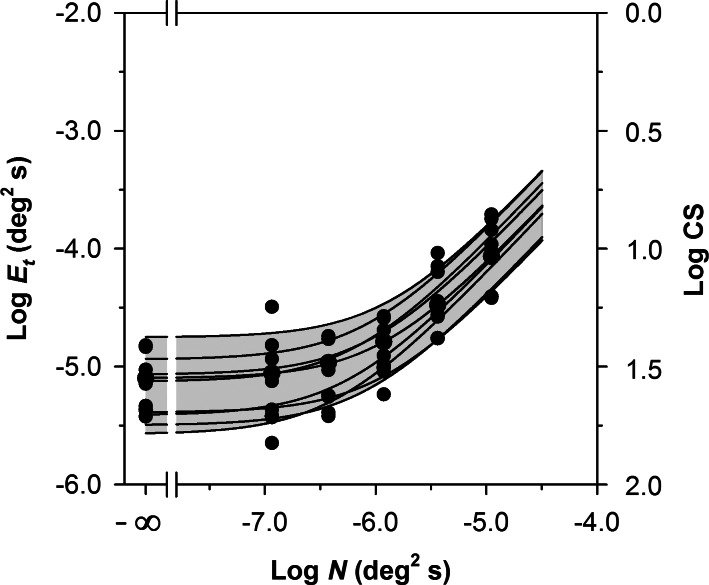
Figure 3. .
Log Et as a function of log N for the 10 normally-sighted control subjects. The log CS equivalents of the log Et values are given on the right y-axis. The curves represent the least-squares best fits of Equation 2 to the data of each individual control subject. The gray region represents the normal range, as defined in the text.

