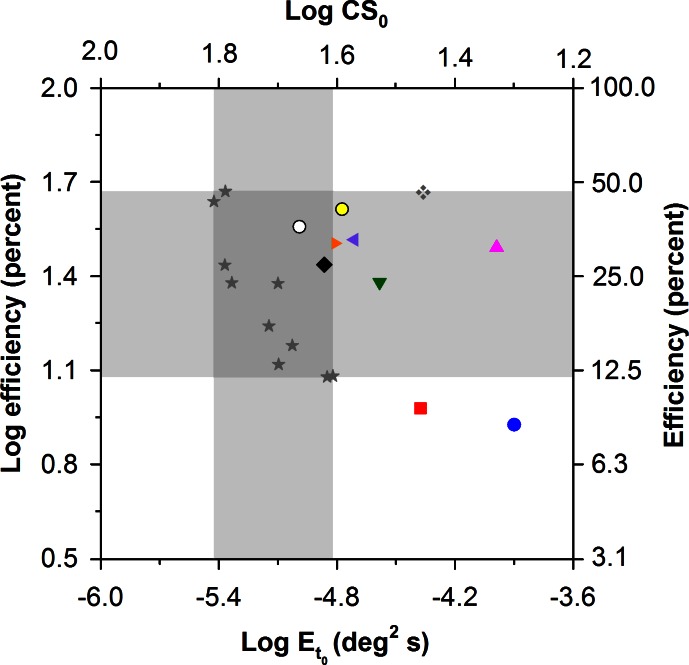
Figure 6. .
Log sampling efficiency versus log Et0 for the 10 patients with RP and the 10 control subjects (stars), with patient symbols corresponding to those of the Table. The gray regions demarcate the normal ranges of log efficiency (horizontal region) and Et0 (vertical region). The log CS0 equivalents (i.e., CS in the absence of noise) of the log Et0 values are given on the top x-axis; the linear values corresponding to log efficiency are given on the right y-axis.

