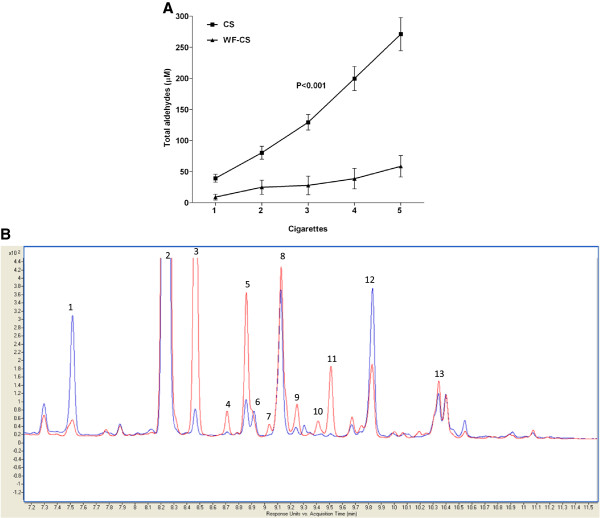
Figure 2.
Comparative smoke analysis of total aldehydes in cigarette smoke (CS) and water-filtered cigarette smoke (WF-CS). (A) Quantification of total aldehydes in CS and WF-CS from 5 cigarettes. Data are expressed as mean values ± SEM and are referred to 4 experiments. P value given above the line represents the significance between CS and WF-CS. (B) Overlay of the HPLC-UV-chromatograms obtained for smoke analysis with the impinger filled with water (blue) and the impinger left empty (red). Peak annotations and fold change are reported in Table 1.

