Figure 3.
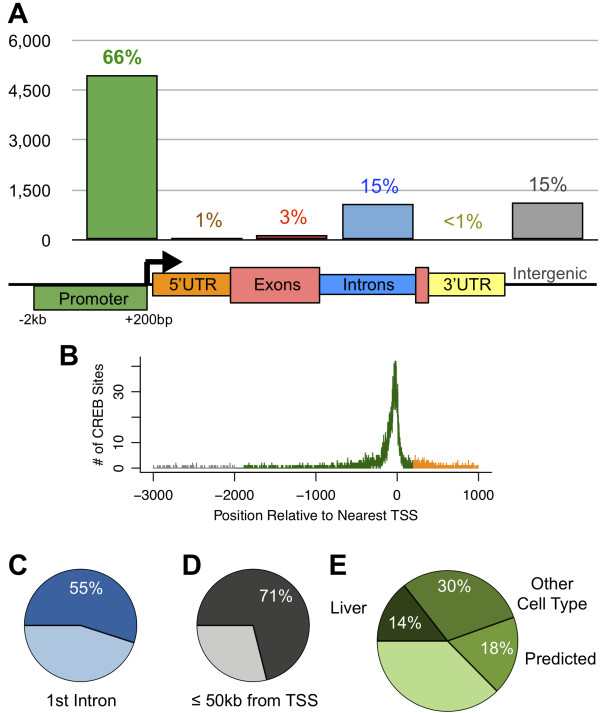
Hepatic CREB binding relative to gene structure. A) The proportion of 7,547 high-confidence CREB binding sites with peak center in promoter regions (green, defined as -2 kb to +200 bp around TSS), 5’ UTR (orange), exons (red), introns (blue), and 3’ UTR (yellow). The remaining sites are considered intergenic (gray). B) Frequency of CREB binding site positions relative to known TSS. Colors correspond to feature definitions used in (A). C) Proportion of intronic CREB sites occurring in the first intron of a known transcript. D) Proportion of intergenic CREB sites occurring within 50 kb of a known TSS. E) We identified 7,095 genes bound by CREB at distal, proximal, or internal sites based on our high-confidence ChIP-seq peaks. Pie chart shows the proportion of target genes previously identified in liver cells [6], other mammalian cell types [6,32], or predicted by bioinformatics analysis [6]. The remaining 2,641 CREB-bound genes were not identified or predicted in the previous genome-wide studies.

