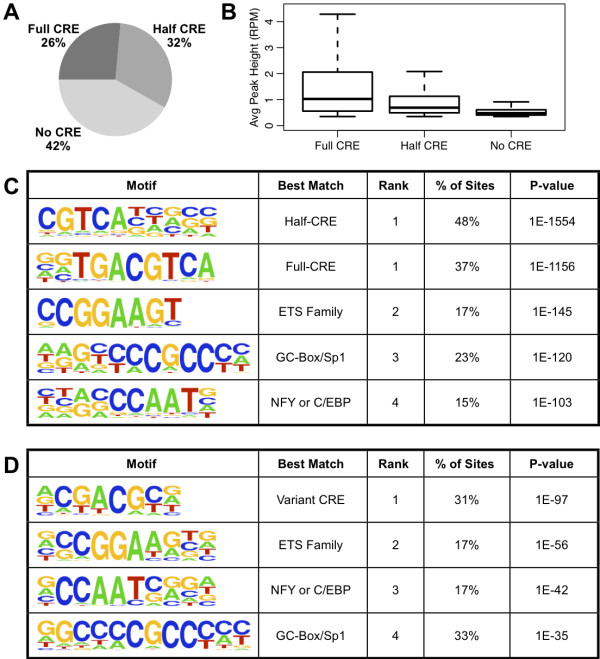
Figure 4.
Motif analysis of CREB binding sites. A) Percentage of binding sites containing a Full CRE (‘TGACGTCA’ with at most one mismatch), Half CRE only (‘TGACG’ exact match), or neither type of CRE within +/- 50 bp of peak center. B) Distribution of peak heights within each category of site identified by sequence content in (A). C) Top five de novo motifs returned by HOMER for the 7,547 high-confidence CREB binding sites in the liver. Sites with the same rank were clustered together as similar motifs by HOMER. Percentage of binding sites and P-value were calculated using the optimal motif score threshold as determined by HOMER. D) Top de novo motifs returned by HOMER for the 3,155 high-confidence CREB binding sites lacking a canonical CRE sequence in (A).

