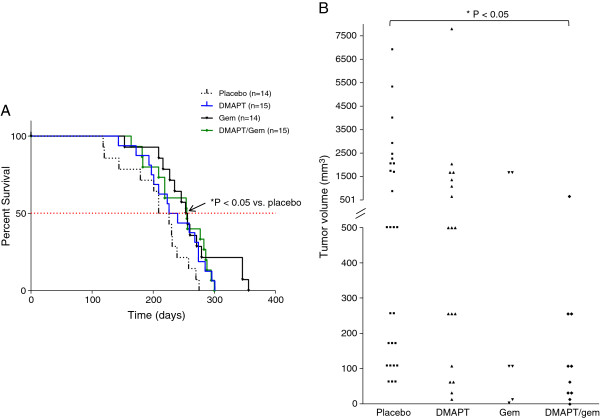
Figure 1.
The effect of treatment on median survival and tumor volume in LSL-KrasG12D/+; LSL-Trp53R172H; Pdx-1-Cre mice. A) Median survival for each treatment group is shown in the Kaplan-Meier survival curve (placebo = 217.5 days; DMAPT = 233 days; Gem = 254.5 days; DMAPT/Gem = 255 days). * P < 0.05 for gemcitabine and DMAPT/gemcitabine vs. placebo by log-rank test. B) The tumor volume of individual pancreatic tumors within each treatment group is shown in the scatter plot. Note the difference in scale. Gem, gemcitabine. * P < 0.05 vs. placebo.

