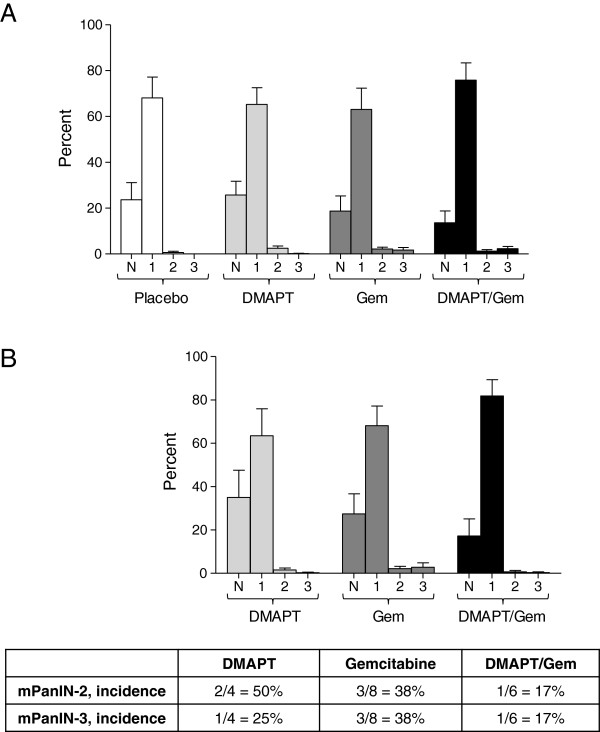
Figure 4.
PanIN analysis. A) The percent normal ducts (N), mPanIN-1 (1), mPanIN-2 (2) and mPanIN-3 (3) for all pancreata within each treatment group is shown as the mean +/− SEM. B) The percent normal ducts and mPanIN-1, -2 and −3 for pancreata without tumors is presented as the mean +/− SEM. The incidence of mPanIN-2 and mPanIN-3 in pancreata lacking tumors is shown in the table below the graph.

