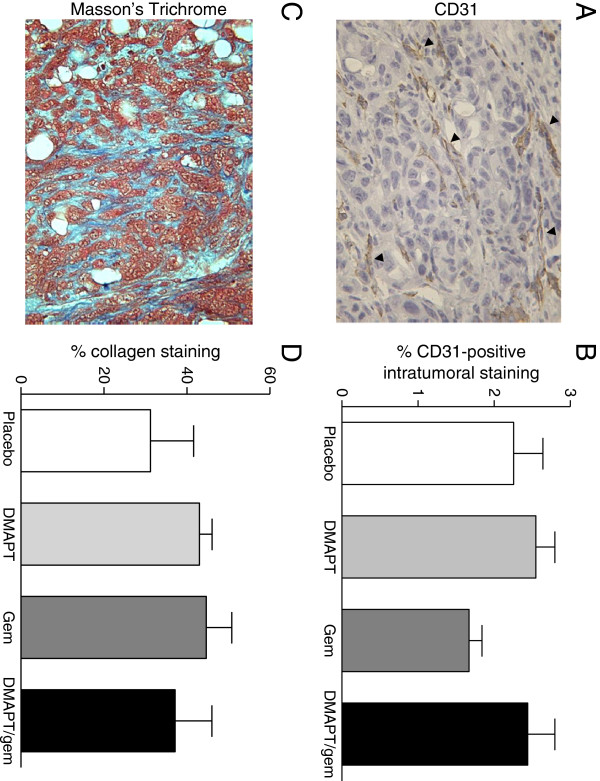
Figure 6.
CD31 and Masson’s Trichrome staining. A) CD31 immunostaining. CD31-positive microvessels (brown) stained as indicated by the black arrowheads (400X magnification). B) Percent CD31-positive intratumoral staining within each treatment group (n = 4-5 mice/group) is shown as the mean +/− SEM. C) Masson’s Trichrome staining to detect the stromal component (blue) is shown (400X magnification). D) Percent collagen staining within each treatment group (n = 5-6 mice/group) is shown as the mean +/− SEM.

