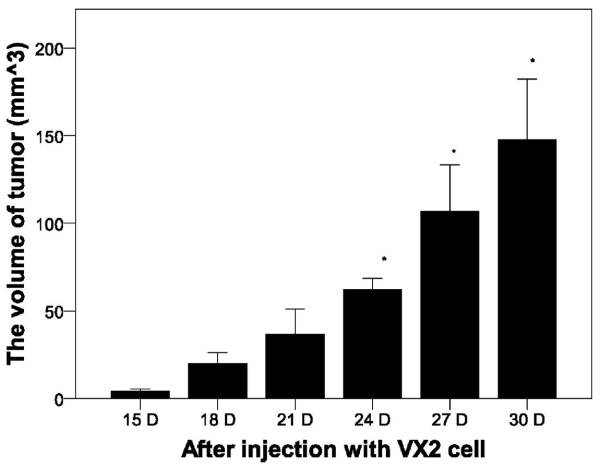
Figure 1.
Tumor volume over time after injection with VX2 tumor cells. The size of tumors in the experimental group was determined at the indicated time points. Results represent the means ± SD at each time point (n = 6 per time point). * Indicates a statistically significant difference between the indicated group and the 15 D group, P < 0.05.

