
Figure 3. Half-life analysis of EU-labeled IFN-β mRNA after poly(I:C) treatment.

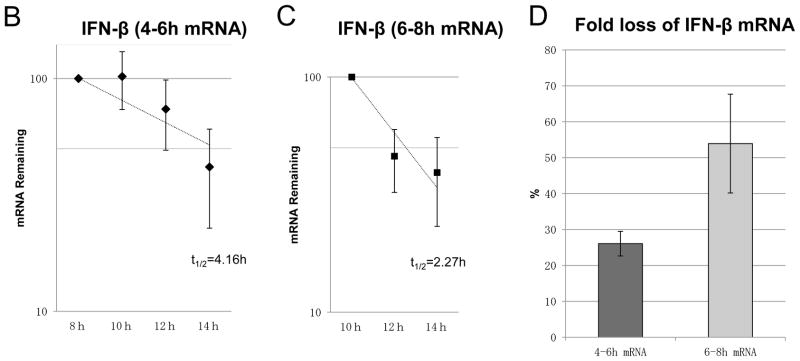

(A) Flowchart illustrating the analysis of the half-life of IFN-β mRNA using EU on BEAS-2B after poly(I:C) treatment. After poly(I:C) treatment on BEAS-2B, EU was added to BEAS-2B at 2 intervals, 4–6 hours (B and E) or 6–8 hours (C and F). EU was washed out with PBS and fresh medium added after 2 hours of RNA pulse metabolic labeling. Total RNA was extracted at the time-points indicated. Remaining EU-labeled RNA was collected using streptavidin dynabeads after biotination. The relative remaining mRNA abundance, normalized to 18S ribosomal RNA, was then analyzed by qRT-PCR for IFN-β (B and C) or IRF3 (E and F). Data was obtained through triplication of 2 experiments. Results are shown as the means ± standard error. (D) Fold loss of labeled IFN-β mRNA at 10–12 hours, synthesized at either 4–6 or 6–8 hour intervals.