
Fig. 1.
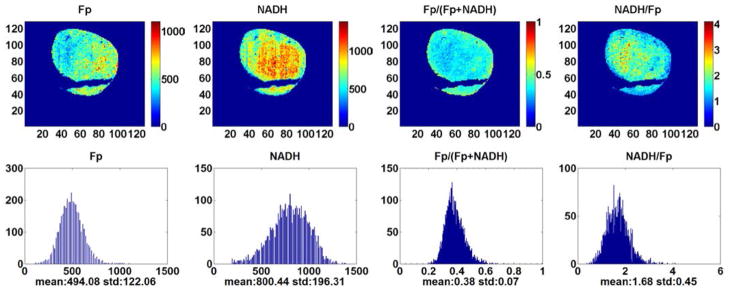
Typical pseudo-color images of the redox indices (top row) and their corresponding histograms (bottom row) of a tumor in CHOP-treated group (1500 μm under the skin). From left to right: Fp nominal concentration (μM), NADH nominal concentration (μM), Fp redox ratio (0–1), and NADH/Fp. The mean value and SD are shown below the x-axes on each histogram. Image resolution: 200 μm.