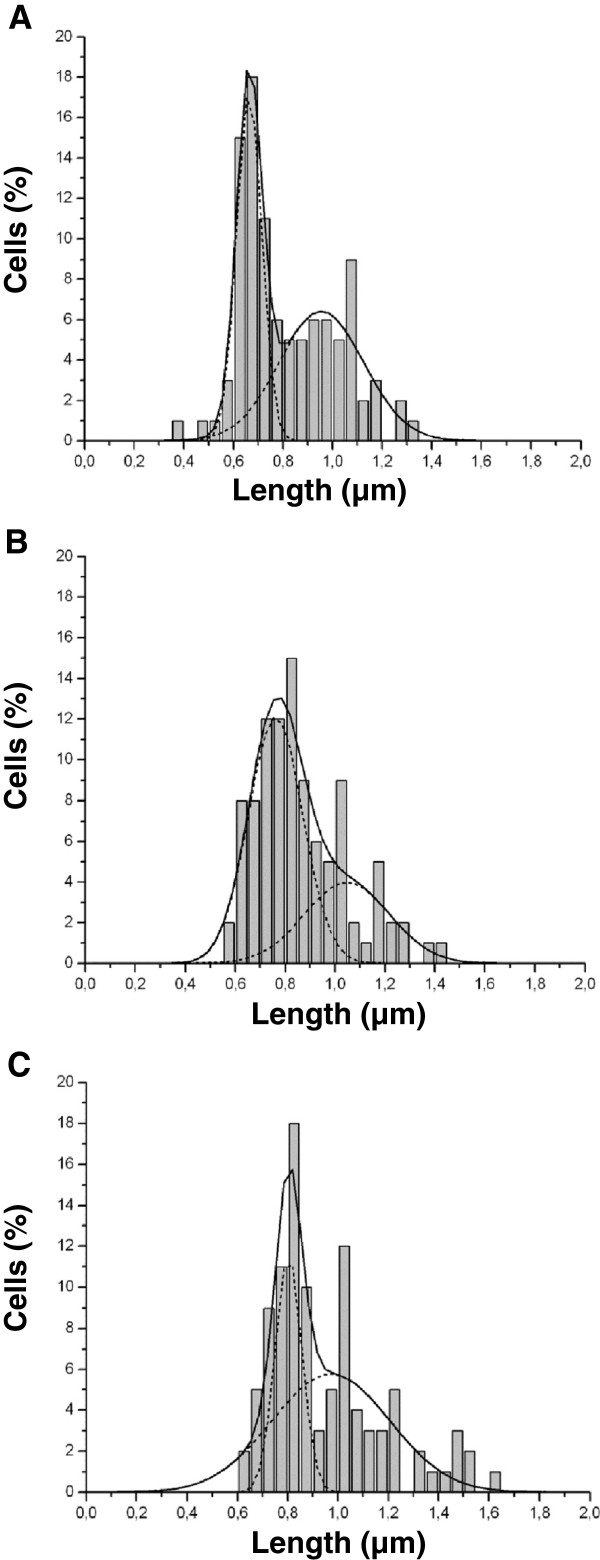
Figure 3.
Cell length distribution of S. mutans (A) and after a three-hour treatment with 1x (B) and 2x (C) LMM fraction of mushroom extract. X1 (centre of the first Gaussian fit) values were 0.663 for image A, 0.761 for B and 0.806 μm for C; W1 (width at half maximum of the first Gaussian fit) values were 0.101, 0.218 and 0.126 μm for images A, B and C, respectively; X2 (centre of the second Gaussian fit) values were 0.955, 1.047 and 0.993 μm for images A, B and C, respectively; W2 (width at half maximum of the second Gaussian fit) values were 0.342, 0.342 and 0.45 μm for images A, B and C, respectively.

