Figure 4.
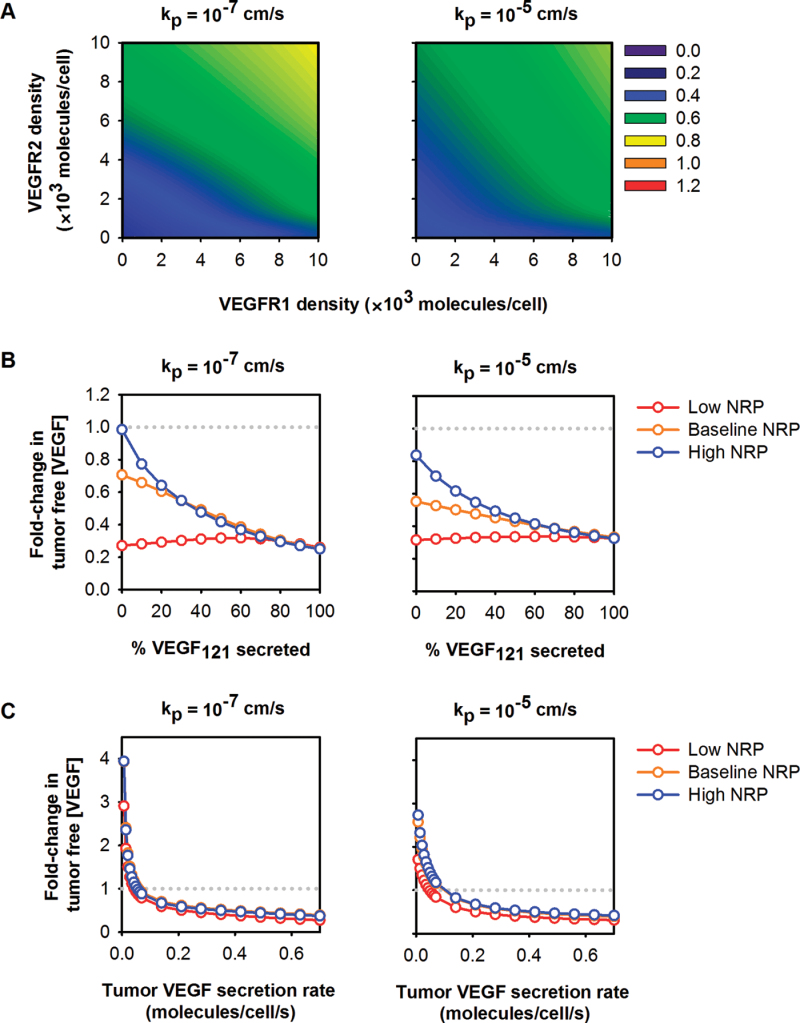
Response of free vascular endothelial growth factor (VEGF) in the tumor to anti-VEGF treatment. A) The fold-change in free VEGF concentration is predicted to be dependent on VEGF receptor 1 (VEGFR1), VEGF receptor 2 (VEGFR2), and neuropilin (NRP) expression on tumor cells for low and high permeability between the blood and tumor. NRP1 = NRP2 = 39 500 molecules/tumor cell. Colors and numbers represent the fold-change in free VEGF in the tumor. A fold-change of less than one indicates a therapeutic response to treatment (ie, tumor interstitial VEGF is reduced). B) The fold-change in free VEGF concentration after anti-VEGF treatment is dependent on the relative amount of VEGF121 secreted by tumor cells and NRP expression levels. C) The absolute rate of VEGF secretion by tumor cells influences the concentration of free VEGF in the tumor after anti-VEGF treatment. For (B) and (C), red: low NRP = 5000 molecules/tumor cell; yellow: baseline NRP = 39 500 molecules/tumor cell; blue: high NRP = 100 000 molecules/tumor cell. The gray dotted line indicates the boundary between therapeutic and countertherapeutic effects.

