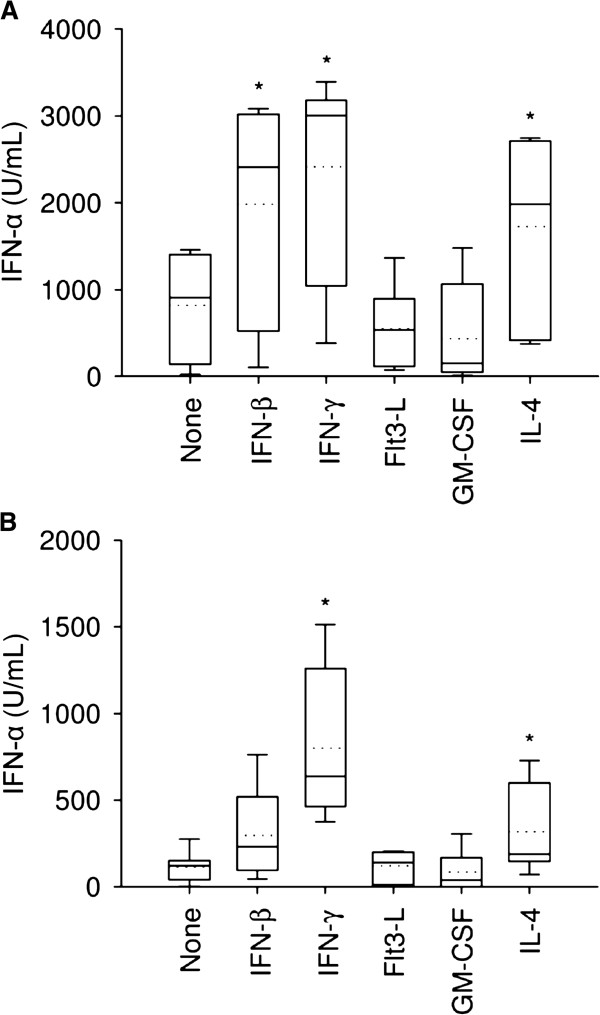
Figure 4.
Cytokine-enhancement of pDC IFN-α production induced by type 1 and 2 PRRSV. LVP23 (A) or VR-2332 (B) at an MOI of 1 TCID50/cell were incubated with pDC alone or in the presence of IFN-β (100 U/mL), IFN-γ (10 ng/mL), Flt3-L (100 U/mL), GM-CSF (100 U/mL) and IL-4 (100 U/mL). IFN-α was determined by ELISA in supernatants harvested after 20 h. Boxplots are marked by the median (middle line), 25th and 75th percentiles (boxes), maximum and minimum values (whiskers) and the mean (dotted line) representing three independent experiments each performed in triplicate cultures. Significant difference in the median value is indicated by an asterisk mark compared to untreated cells (“none”) using the Mann–Whitney Rank Sum test (P < 0.02).

