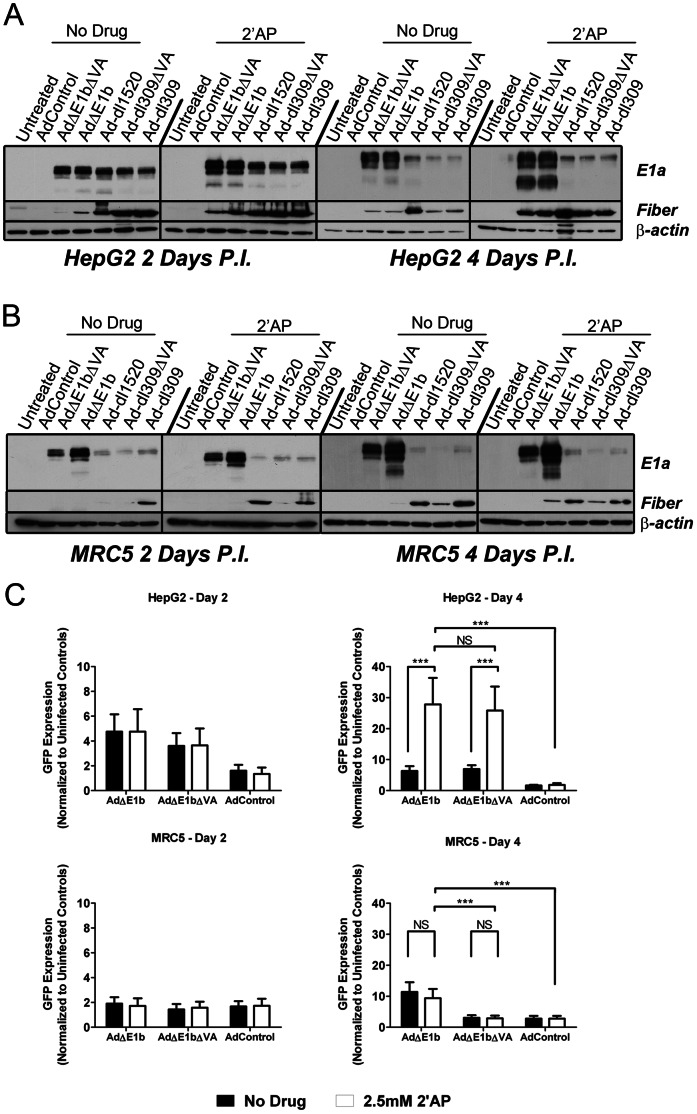
Figure 5. Treatment of HepG2 cells with 2′AP increased expression of virally encoded E1a, fiber and GFP.
(A) HepG2 or (B) MRC5 cells were mock infected or infected with the indicated viruses at MOI of 100 VP/cell and then incubated for 2 days or 4 days, with or without 2.5 mM 2′AP treatment. Cells were washed and lysed and western blot analysis was performed on 10 µg protein per lane using antibodies against E1a, fiber and β-actin. (C) HepG2 and MRC5 cells were infected with AdΔE1b, AdΔE1bΔVA or AdControl at MOI of 100 VP/cell and then incubated in the absence or presence of 2.5 mM 2′AP. Green fluorescence intensity was measured 2 and 4 days post-infection and normalized to uninfected controls. Error bars correspond to +/−SD of quadruplicates (NS – Not Significant; ***p<0.001, one-way ANOVA).

