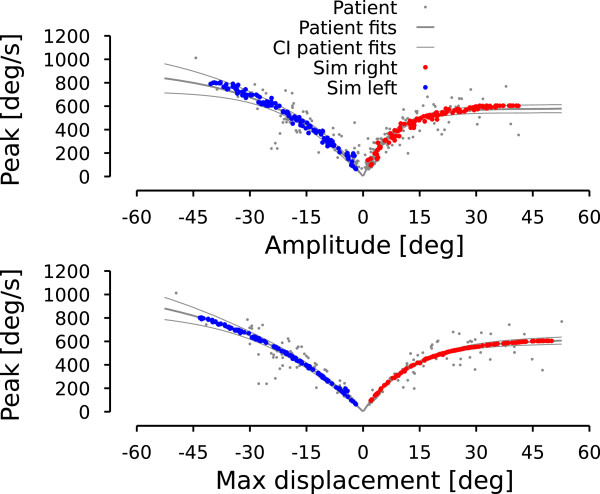
Figure 9.
Model simulation: patient saccadic average behavior. Superimposed on the patient data of Figure 4, this figure shows how the model reproduces the average behavior of the patient. Red dots represent rightward simulated saccades. Blue dots represent leftward simulated saccades. Same layout as in Figure 4.

