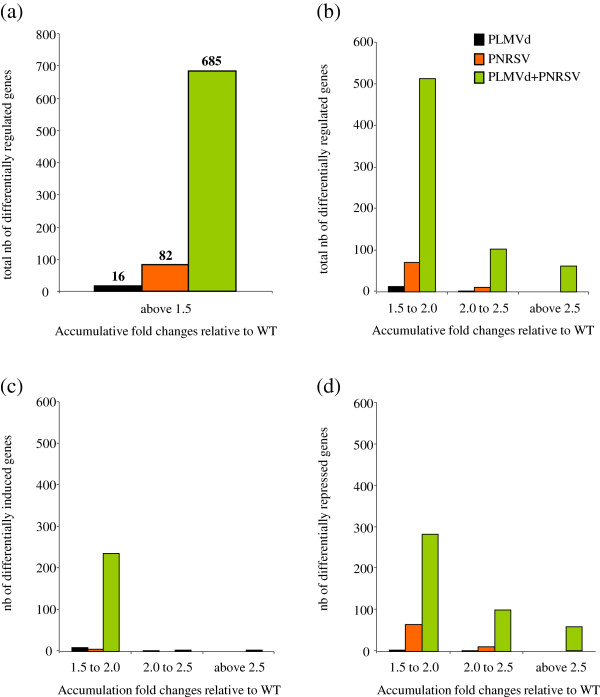
Figure 3.
Number of genes with significant expression changes upon infection. The number of genes with significant expression changes upon infection is shown for PLMVd (black bars), PNRSV (orange bars) or PLMVd-PNRSV (green bars) infected peach fruits. (a) Total number of differentially regulated genes with accumulative fold changes above 1.5. (b) Total number of differentially regulated genes with accumulative fold changes in three different intervals: 1.5 to 2.0, 2.0 to 2.5 and above 2.5. (c and d) Total number of differentially induced and repressed genes respectively, with accumulative fold changes between 1.5 and 2.0, 2.0 and 2.5 and above 2.5.

