
Figure 4.
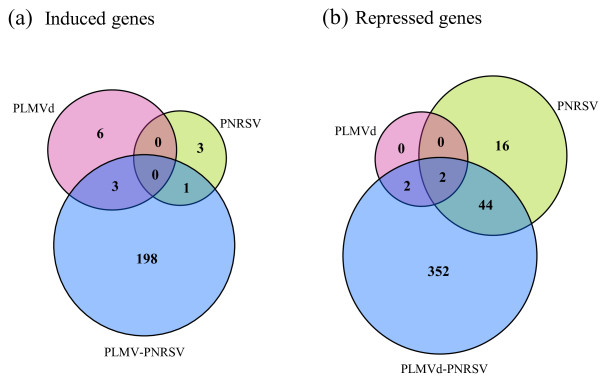
Venn diagrams displaying the overlap in differentially regulated genes upon single or double infection with PLMVd or PNRSV. Overlap in differentially induced (a) and repressed (b) gene sets upon infection with PNRSV, PLMVd or both. Numbers shown in the nonintersecting segments represent the number of genes with statistically significant expression changes unique to each infected sample whereas numbers within intersections represent the number of genes with statistically significant expression changes occurring in common upon infection with PLMVd, PNRSV, or double infection.