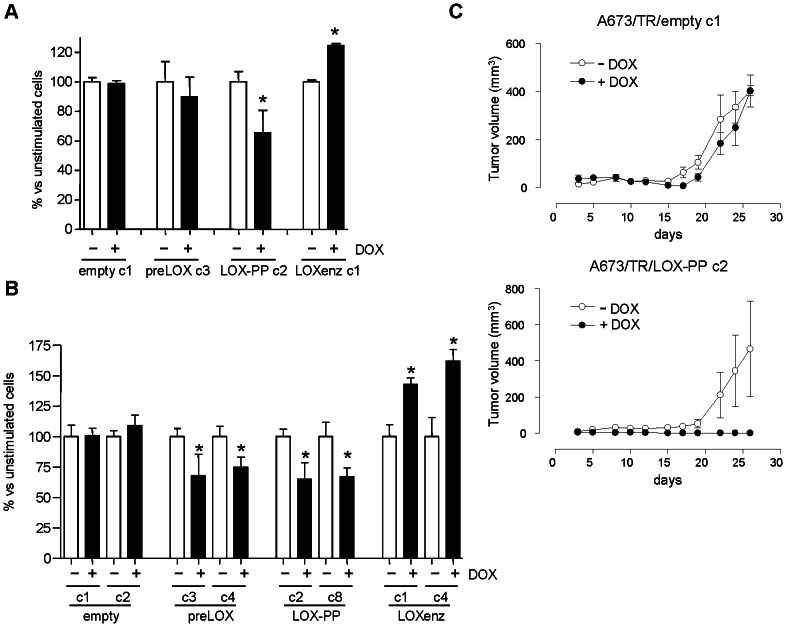
Figure 5. LOX-PP induction inhibits growth in soft agar, cell migration and tumor growth in vivo.
A) A673/TR/empty, A673/TR/preLOX, A673/TR/LOX-PP and A673/TR/LOXenz cells were grown in soft agar in the absence or in the presence of doxycycline (DOX, 1 µg/ml)) for 25 days. Culture dishes were then photographed and colony number was calculated. The figure shows the mean±SEM of three independent experiments done in triplicate. Data are shown as percentage versus unstimulated cells, which were arbitrarily set to 100 (*P<0.05, versus unstimulated cells). B) Two representative clones of A673/TR/empty, A673/TR/preLOX, A673/TR/LOX-PP and A673/TR/LOXenz cells were incubated in the absence or in the presence of doxycycline (DOX, 1 µg/ml) during 48 hours to induce the expression of the corresponding proteins. Afterwards, cells were placed in the upper compartment of a transwell and allowed to migrate through the membrane in response to serum. Migrating cells were quantified by crystal violet staining. The figure shows the mean±SEM of one experiment done in triplicate. Data are shown as percentage versus unstimulated cells, which were arbitrarily set to 100 (*P<0.05, versus unstimulated cells). C) Nude mice were injected with A673/TR/empty clone 1 (n = 7) or A673/TR/LOX-PP clone 2 (n = 8) cells and split in two groups, one of which was given doxycycline (DOX, 1 mg/ml) in the drinking water to induce the expression of the corresponding protein. The figure shows the evolution of tumor volume (mean±SEM of 3–4 animals per group) versus time.

