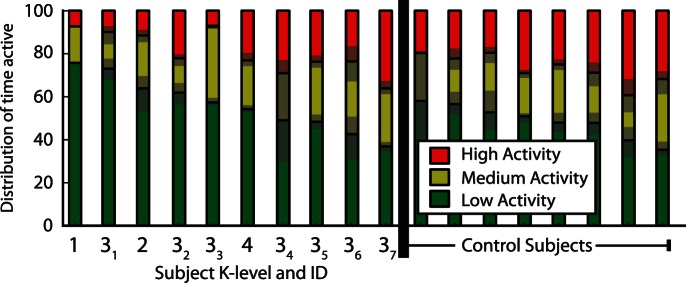
Figure 3. The distribution of activity level for each subject.

To aid interpretation, the participants have been ordered based on overall activity level (medium+high). The IDs correspond to the subject K-levels, and subscripts are given to match the description of subjects in Table 2. The gray transparency indicates the 95% confidence interval using bootstrapping over days recorded.
