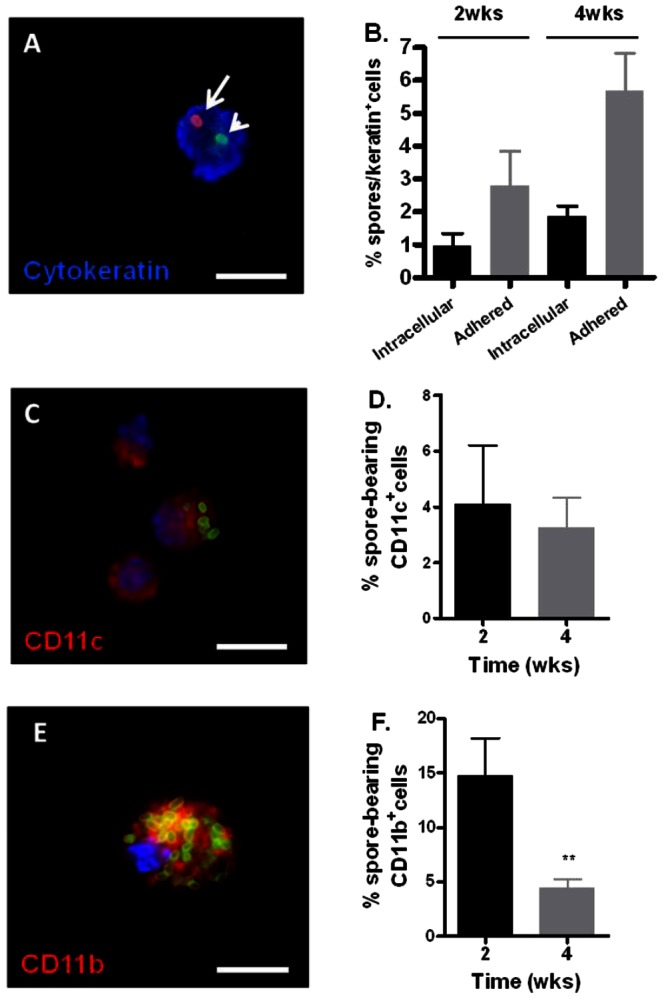
Figure 8. Spore association with epithelial cells and phagocytes in the lung.

Mice were inoculated i.n. with ∼1.1×10⁸ spores per mouse. At 2 and 4 weeks post-infection, lungs were harvested and digested to obtain CLCS. Lungs were also lavaged to obtain BAL fluid. A, a representative image of a lung epithelial cell stained with anti-cytokeratin antibodies (blue) containing an extracellular spore (red, long arrow) and an intracellular one (green, short arrow). B, the percentage ratio of intracellular and extracellular adhered spores relative to the number of cytokeratin+ cells counted at 2 and 4 weeks post-inoculation, expressed as the mean±standard error of the mean (SEM). Approximately 500–600 cytokeratin+ cells were counted per mouse. C and E, representative images of cells stained positive with CD11c antibodies (C, red) and CD11b antibodies (E, red). Spores were stained green. Blue indicates DAPI staining for the nuclei. D and F, the percentage ratio of spore-containing CD11c+ and CD11b+ cells relative to the total number of CD11c+ and CD11b+ cells counted at 2 and 4 weeks post-inoculation, respectively, expressed as the mean±SEM. Approximately 100 CD11c+ cells and 500–600 CD11b+ cells were counted per mouse. Scale bars represent 10 µm. **, p<0.01 comparison between 2 to 4 weeks % spore-bearing CD11b+ cells.
