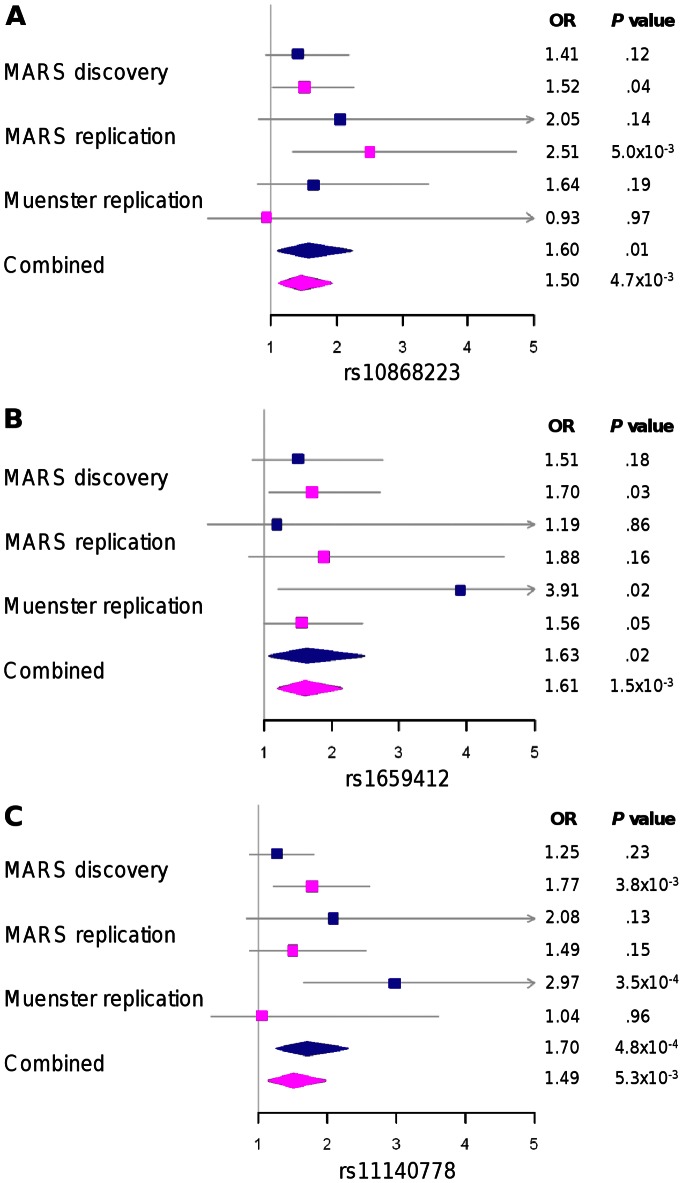
Figure 2. Forest plots for the three replicated NTRK2 SNPs rs10868223 (A), rs1659412 (B) and rs11140778 (C).
For each sample, odds ratios and P values calculated with the Armitage’s test are indicated separately for the two phenotypes remission at discharge (blue boxes) and response after week 5 (pink boxes). Diamonds were used for the combined sample (N = 894).

