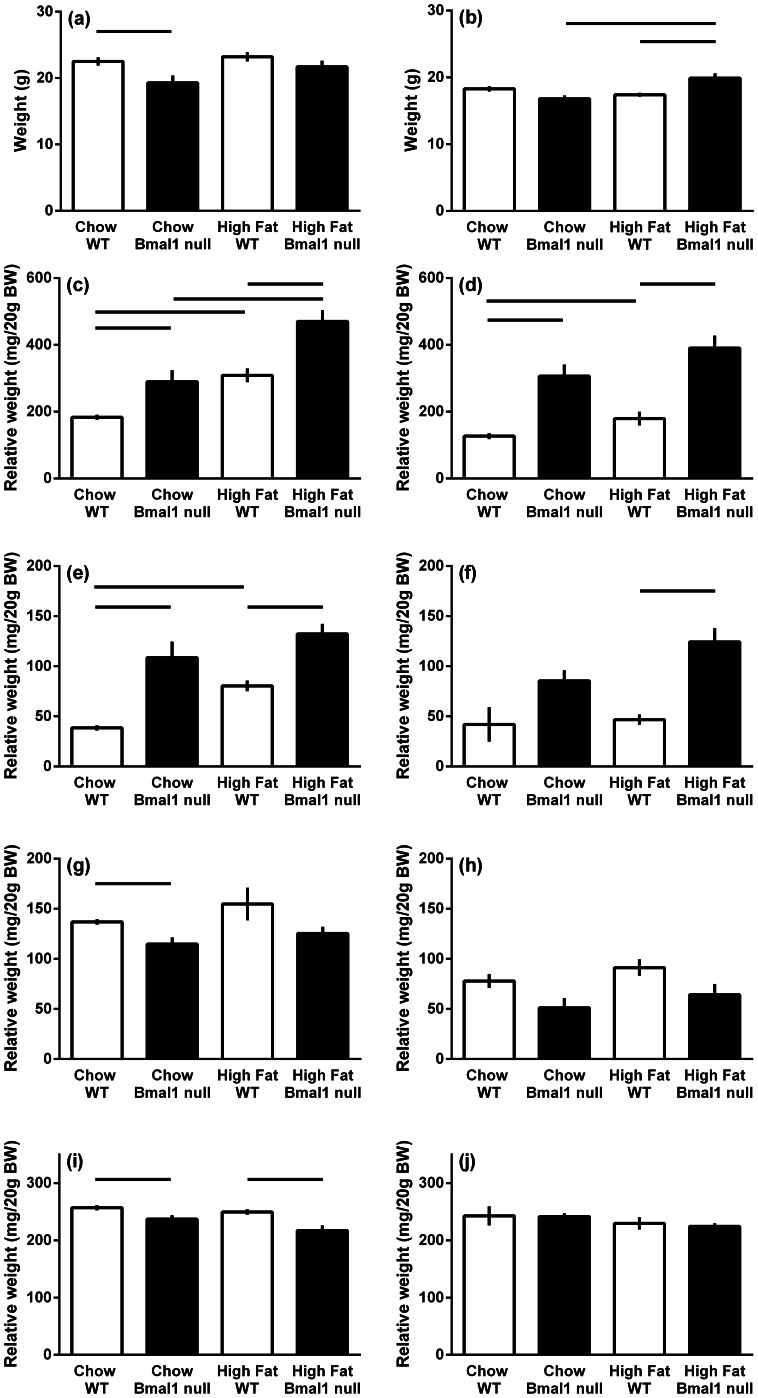
Figure 3. The body composition of male and female wild-type and Bmal1 null mice fed either normal rodent chow or a high fat diet (22% fat).
The data are the means (grams or grams per 20 grams body weight ± s.e.m.; n = 13–19 mice per group). Body weight (a, b), epigonadal fat pad (c, d), retroperitoneal fat pad (e, f), testis/uterus (g, h) and kidney (i, j). Males (a, c, e, g, i); females (b, d, f, h, j). Bars above the histogram define the difference between the groups with significant difference set to P<0.0125.

