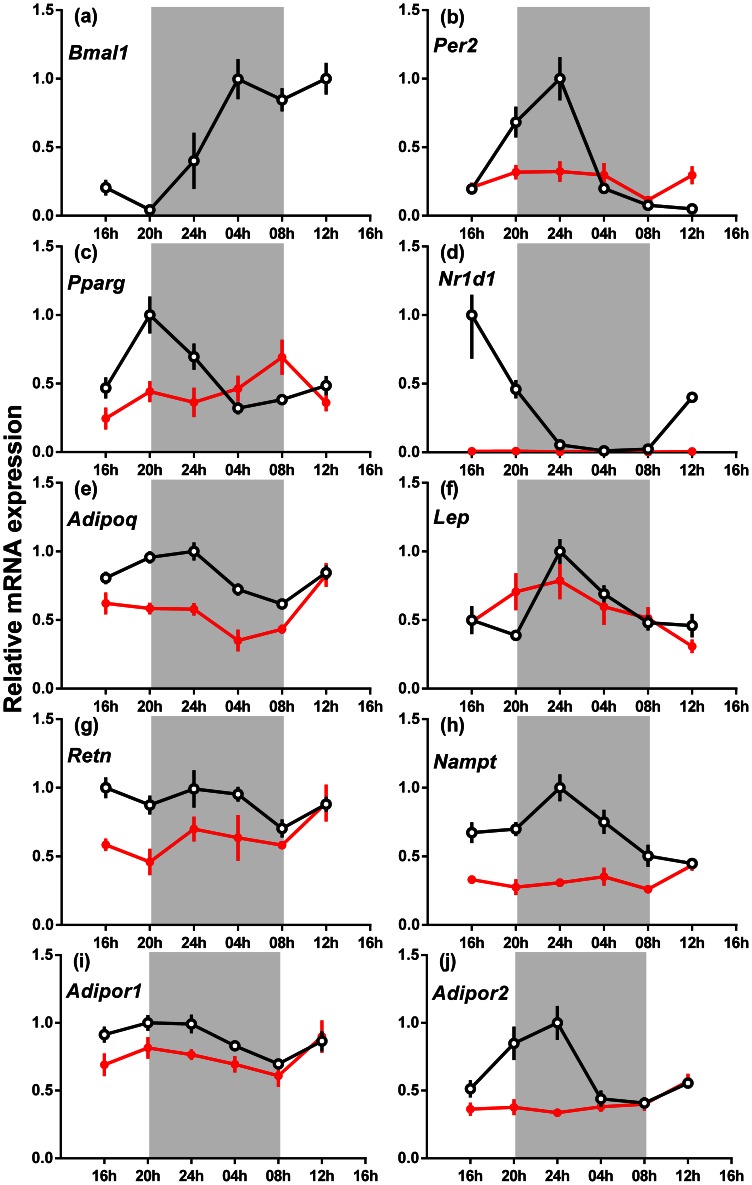
Figure 5. The relative gene expression across 24 h of clock and other genes in the epigonadal adipose tissue of male wild-type and Bmal1 null mice fed a normal rodent diet.
(a) Bmal1, (b) Per2, (c) Pparγ, (d) Nr1d1, (e) Adipoq, (f) Lep (g) Retn, (h) Nampt (i) Adipor1 and (j) Adipor2. The data are the relative expression for each gene compared to Actin mRNA (mean ± s.e.m., n = 4 for each genotype), wild-type mice (open circles) and Bmal1 null mice (closed circles). The highest expression of each gene for wild-type mice was set at one. The apparent absence of an SEM bar indicates that it is obscured by the symbol. The shaded areas represent the period of darkness.

