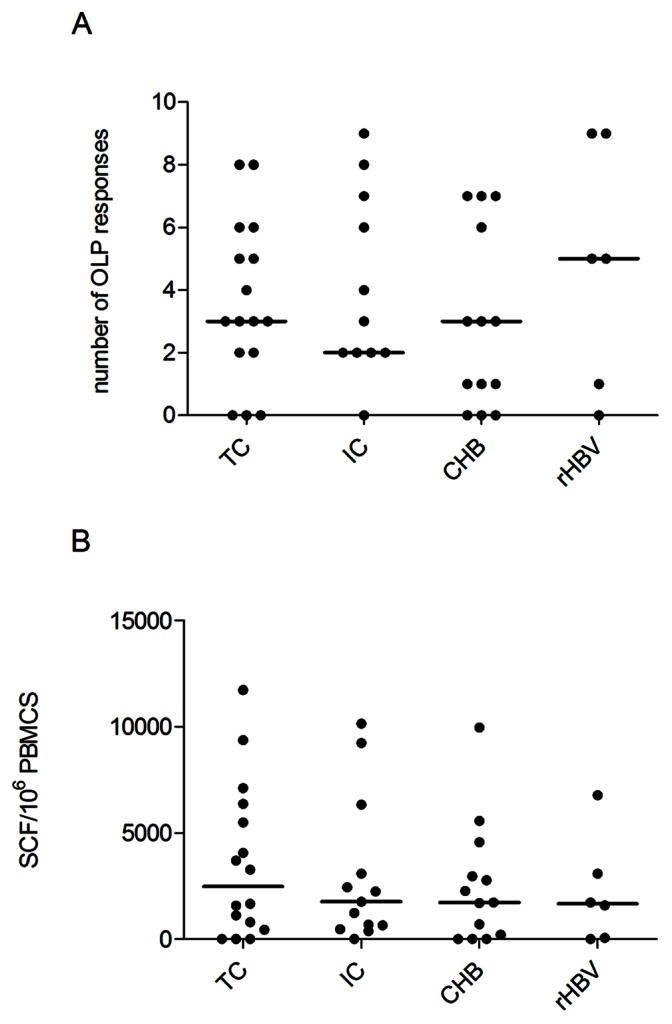
Figure 1. Breadth and magnitude of anti-HBV specific T cell response in the four groups of patients.

A) Breadth (number of targeted peptides) and B) magnitude (number specific cells) of the anti-HBV specific T cell response in the four patients groups. Total magnitude was determined by adding magnitudes obtained for all targeted peptides by each patient. Each symbol represents an individual patient, with black horizontal bars showing the median values per patient group.
