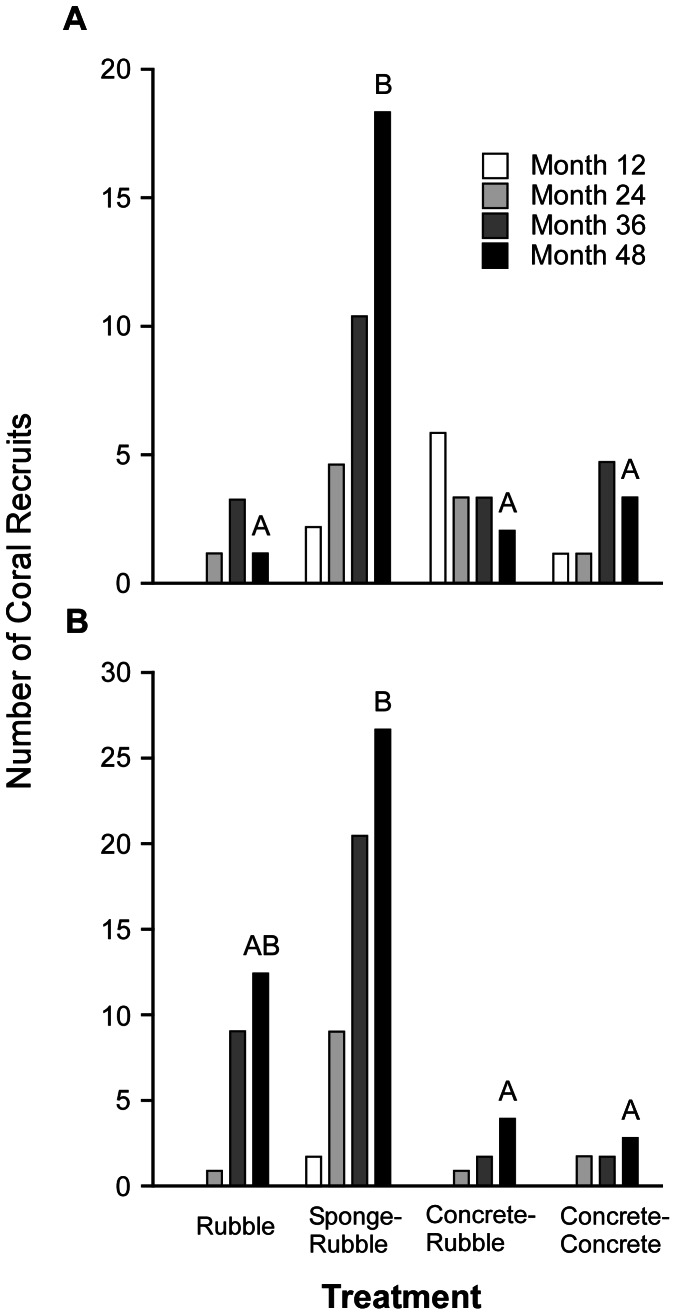
Figure 6. Number of coral recruits at each site, during each survey, by treatment.
A. Sea Aquarium. B. Barracuda point. For Sea Aquarium (A): open, light gray, dark gray and black bars indicate the number of coral recruits at months 12, 24, 36, and 48, respectively. For Barracuda Point (B): open, light gray, dark gray and black bars indicate the number of coral recruits at months 12, 21, 33, and 45, respectively. Letters above black bars (months 48 and 45 for Sea Aquarium and Barracuda Point, respectively), indicate significant differences (P<0.05) among treatments within each site in the number of coral recruits based on pairwise comparison with Bonferroni correction. Within each site, bars that share the same letter are not significantly different (P>0.05) from one another.

