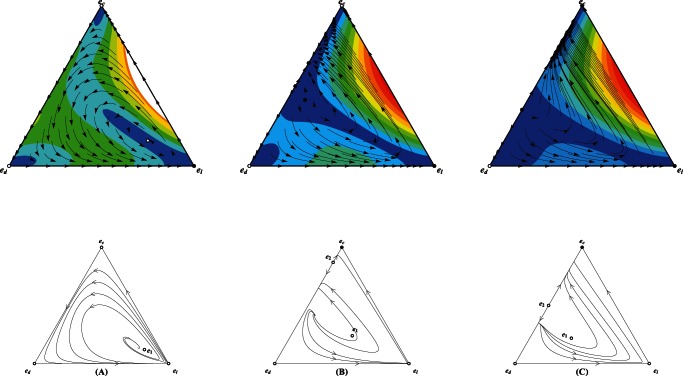
Figure 7. Triangle plots illustrating the population dynamics for defectors ( ), cooperators (
 ) and loners (
 ) for trajectories starting from all possible initial frequencies for the inverse-sigmoidal risk removal pattern.
Each vertex represents a homogeneous population of that pure strategy.  For small interest rate
  , all orbits starting from the inside area of
  converge to
  .
.  Moderate
  delimits the inside area into two attraction basins. The equilibrium
  , a coexistence state of cooperators and defectors, accounts a relatively large area as its attraction basin. The rest of the inside area is the loner's attraction basin.
  Further increase in
  makes the
  coincide with
  and its attraction area spreads almost the whole inside area. Relevant parameters
  ,
,  and
and 
 ,
, 
 ,
, 
 .
.

