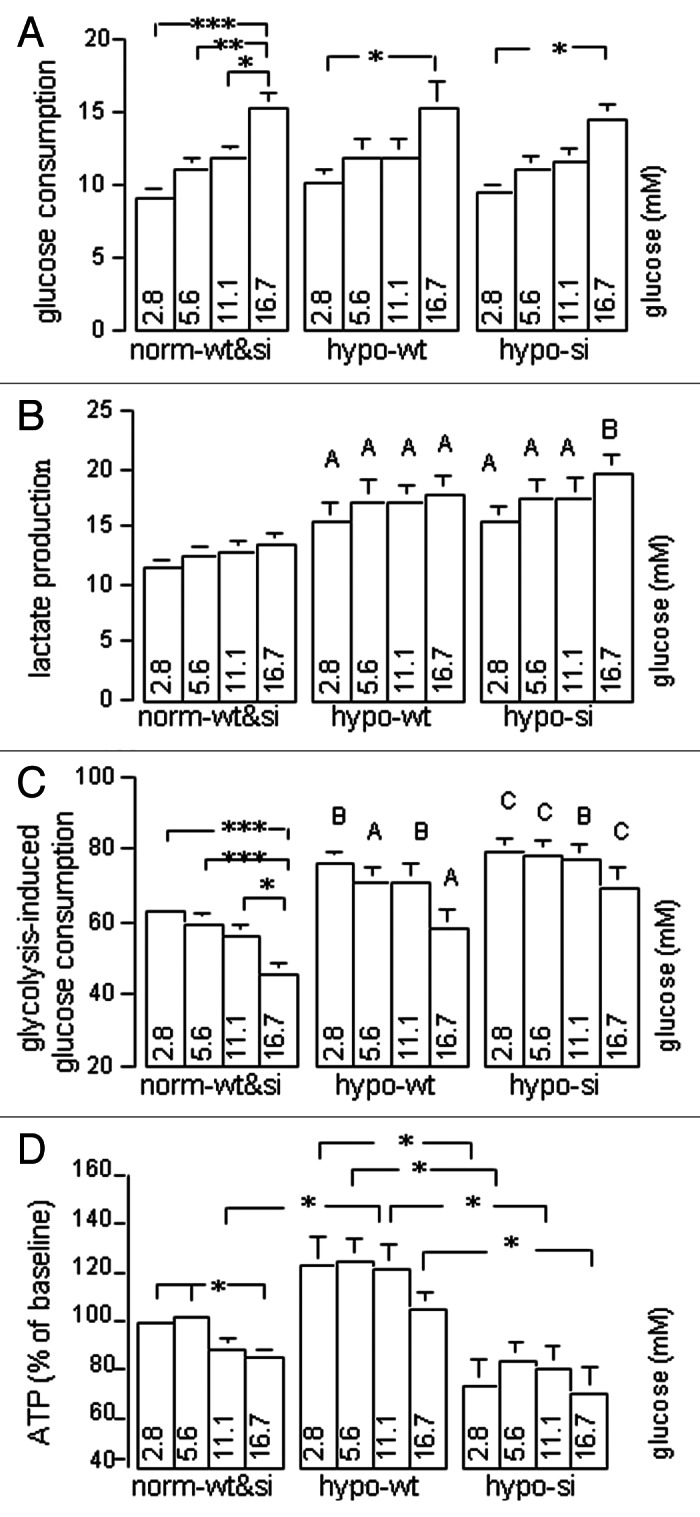
Figure 5. Normoxic wt- and si-MiaPaCa2 cells (norm-wt&si), hypoxic wt-MiaPaCa2 cells (hypo-wt) and hypoxic si-MiaPaCa2 cells (hypo-si) were incubated for six hours in KH buffers with different amounts of glucose. Glucose and lactate were determined in removed buffers. (A) Glucose consumption (nmol/μg of protein) denotes the differences between glucose concentrations in fresh buffers and those in used buffers. (B) Lactate production (nmol/μg of protein) denotes lactate concentrations in used buffers. (C) Glycolysis-induced glucose consumption was calculated using the formula: lactate production ÷ glucose consumption ÷ 2 × 100. (D) Intracellular ATP was determined, using data from normoxic cells with 2.8 mM glucose as a baseline (100%). Data in panels A−C are derived from ≥ 13 experiments and those in panel D from 9 experiments. *p < 0.05, **p < 0.01 and ***p < 0.001. Capital letters in panels B and C indicate significant differences between the values of indicated hypoxic cells and those of the normoxic cells that were treated with the same glucose concentrations; A (p < 0.05), B (p < 0.01) and C (p < 0.001).
