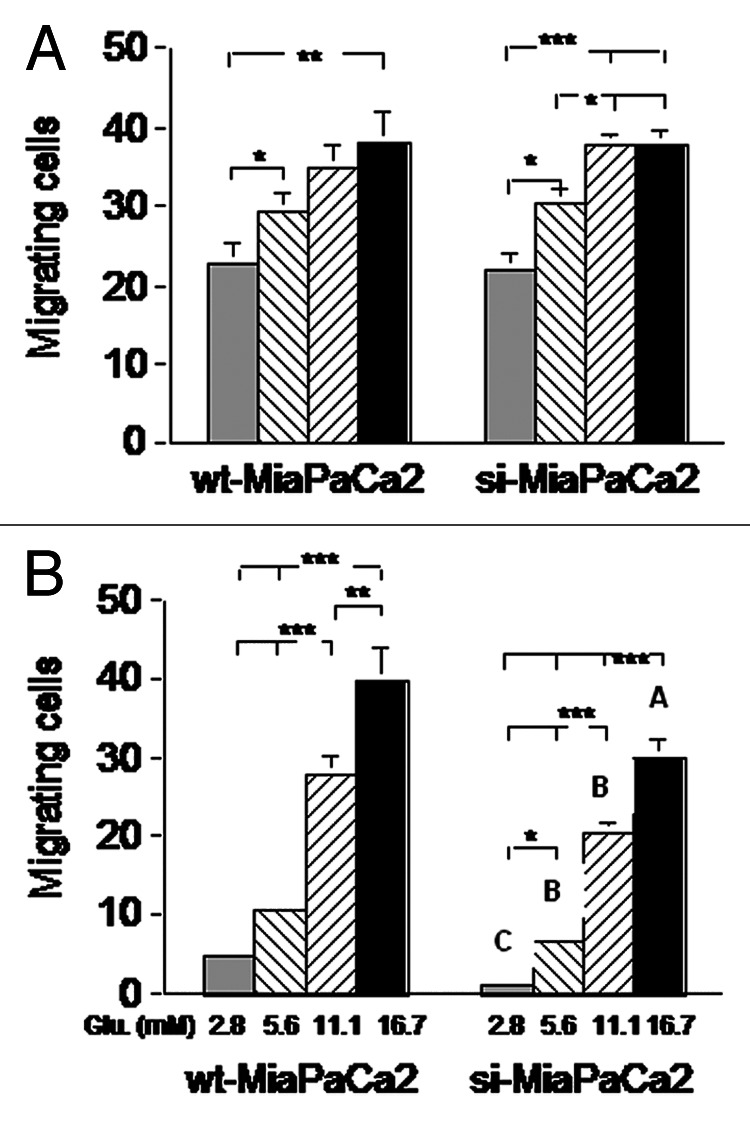
Figure 7. Wt- and si-MiaPaCa2 cells were placed in a Boyden chamber (with a porous membrane) and incubated in normoxia (A) or hypoxia (B) for 16 h. Cells found on the opposite side of the membrane were counted. Each experimental condition was tested in ≥ 25 wells at different time points. *p < 0.05, **p < 0.01 and ***p < 0.001. Capital letters in panel B indicate significant differences between indicated si-MiaPaCa2 cells and their wt-MiaPaCa2 counterparts; A (p < 0.05), B (p < 0.01) and C (p < 0.001).
