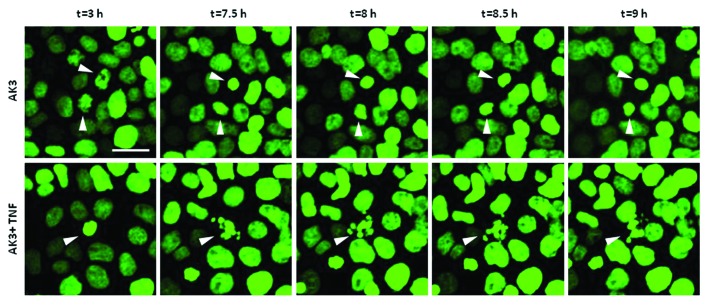
Figure 6. Mitotically arrested cells undergo apoptosis. Time lapse imaging of histone H2B-GFP expressed in HT29 cells. Cells were treated with either AK3 (top) or AK3 plus TNF (bottom). Representative images show chromatin condensation in the cells treated with AK3 alone, whereas addition of TNF in combination with AK3 increased apoptosis of the mitotic cells. Bar, 25 μm. Arrows point to the cells undergoing mitosis (top panel and bottom panel, t = 3h) and/or apoptosis (bottom panel).

An official website of the United States government
Here's how you know
Official websites use .gov
A
.gov website belongs to an official
government organization in the United States.
Secure .gov websites use HTTPS
A lock (
) or https:// means you've safely
connected to the .gov website. Share sensitive
information only on official, secure websites.
