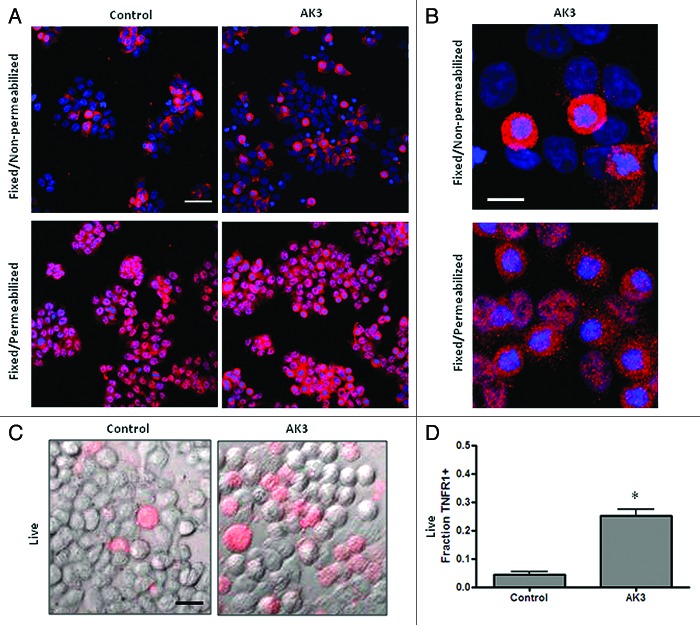
Figure 8. Mitotic cells have a higher surface expression of TNFR1. (A) HT29 cells were treated with AK3 and then fixed with PFA. Fixed cells were either stained directly with a TNFR1 antibody or were stained following permeabilization with Triton X-100. All cells show TNFR1 expression following permeabilization but staining is more variable in the absence of Triton X-100 permeabilization. Bar, 100 μm. (B) Higher magnification of AK3 treated cells stained for TNFR1, with or without permeabilization (as indicated). Mitotic cells with round morphology and condensed chromatin frequently show elevated TNFR1 expression. Bar, 10 μm. (C) Live cells stained for surface expression of TNFR1. HT29 cells were transferred to ice and stained directly for TNFR1 expression. Bar, 25 μm. (D) Quantification of the live cells expressing TNFR1 on the surface. Images were captured and quantified for the number of cells staining with the TNFR1 antibody. Significantly more cells stained for surface expression of TNFR1 after AK3 treatment (p < 0.01; Student’s t test).

An official website of the United States government
Here's how you know
Official websites use .gov
A
.gov website belongs to an official
government organization in the United States.
Secure .gov websites use HTTPS
A lock (
) or https:// means you've safely
connected to the .gov website. Share sensitive
information only on official, secure websites.
