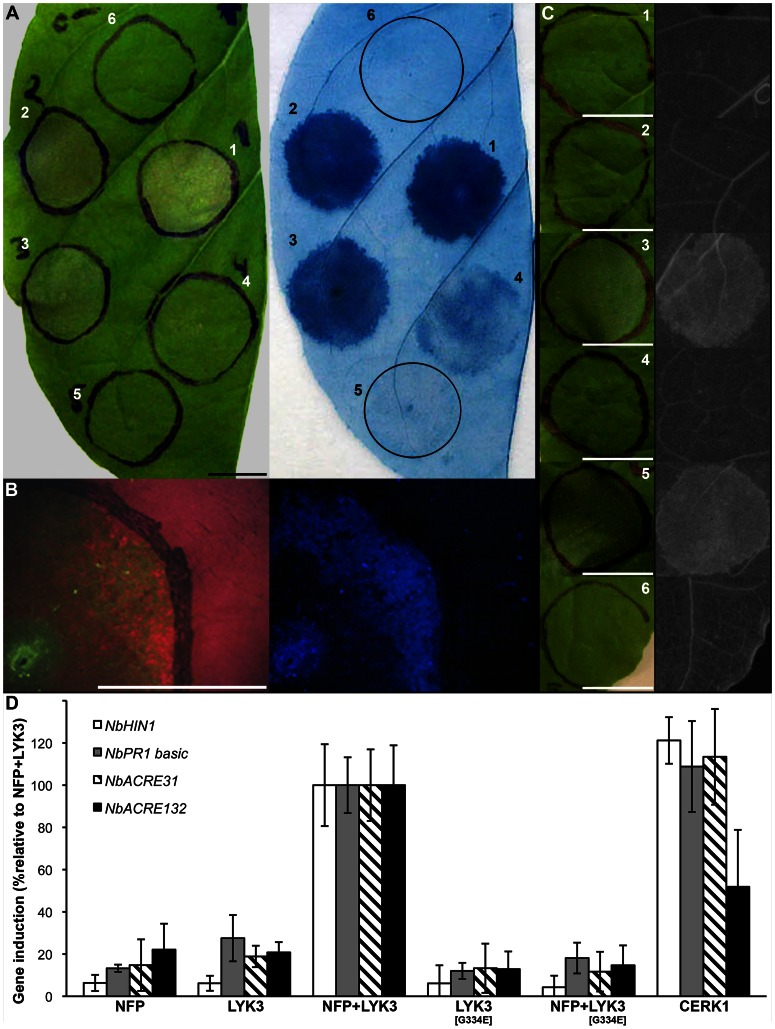
Figure 4. MtNFP and MtLYK3, or AtCERK1 (co-)production in Nicotiana leaves induces defence-like responses.
A, Kinetics of cell death development in Nicotiana. Agrobacterium transformants carrying either MtNFP-3xFLAG or MtLYK3-3xFLAG construct were co-infiltrated into Nicotiana leaves at five different time points (1–5). Macroscopic observation (left panel) and subsequent Evans blue staining (right panel) are depicted 42 hai (region 1), 39 hai (region 2), 36 hai (region 3), 33 hai (region 4) and 30 hai (region 5). Mock infiltration (region 6) was done concomitantly with the infiltration of region 1. Bar is 1 cm. B, Changes in leaf autofluorescence upon MtNFP and MtLYK3 co-production. Leaf regions co-producing MtNFP-3xFLAG and MtLYK3-3xFLAG fusions were analyzed between 24 and 48 hai (here depicted 36 hai) using a stereoscope. Note the decrease in chlorophyll content, as indicated by the decrease of far-red autofluorescence of chlorophyll (left panel), and enhanced accumulation of blue light-excited autofluorescence (right panel) within the infiltrated region. Bar is 1 cm. C, Accumulation of phenolic compounds. The following fusions were (co-)produced in Nicotiana leaves: MtNFP-3xFLAG (1); MtLYK3-3xFLAG (2); MtNFP-3xFLAG+MtLYK3-3xFLAG (3); MtNFP-3xFLAG+MtLYK3[G334E]-3xFLAG (4); AtCERK1-3xFLAG (5); or AtCERK1[K349]-3xFLAG (6). Macroscopic observations (left panel) and subsequent UV-excited autofluorescence of ethanol/lactophenol-cleared (right panel) leaf regions are depicted 36 hai (except for 5–30 hai). Bars are 1 cm. D, Induction of NbHIN1, NbPR1 basic, NbACRE31, and NbACRE132 expression in response to separate production or co-production of: MtNFP-3xFLAG (NFP), MtLYK3-3xFLAG (LYK3), MtLYK3[G334E]-3xFLAG (LYK3[G334E]), and AtCERK1-3xFLAG (CERK1). Leaf samples were collected 24 hai and induction of gene expression was analyzed using qRT-PCR. Histograms represent induction of NbHIN1 (white columns), NbPR1 basic (grey columns), NbACRE31 (hatched columns), and NbACRE132 (black columns) normalized by one reference gene, MtEF1 α. Induction of each gene was normalized to that caused by mock infiltration, and then calculated as % induction relative to the induction observed upon co-production of MtNFP and MtLYK3 fusions. Bars represent standard deviation of the mean. At least two technical replicates from two biological replicates were analyzed.

