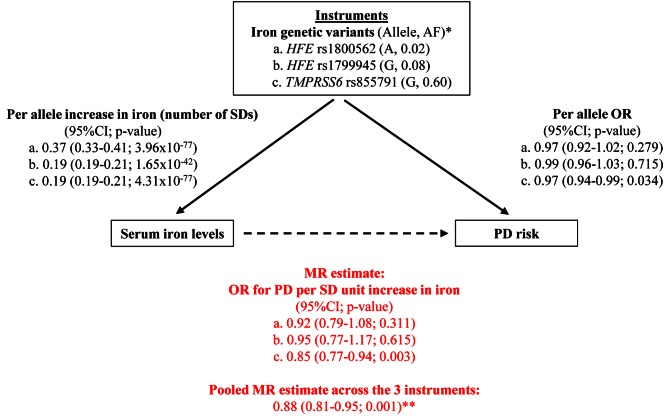
Figure 1. Graphical representation of the MR approach, with all estimates used to derive the final MR estimate.
*Reported is the allele that increases iron levels, together with its frequency (AF). **This corresponds approximately to an OR per unit µg/dl increase in iron of 0.997 (95%CI 0.994–0.999), that is 0.3% (0.1%–0.6%) relative reduction in PD risk per 1 µg/dl increase in iron.

