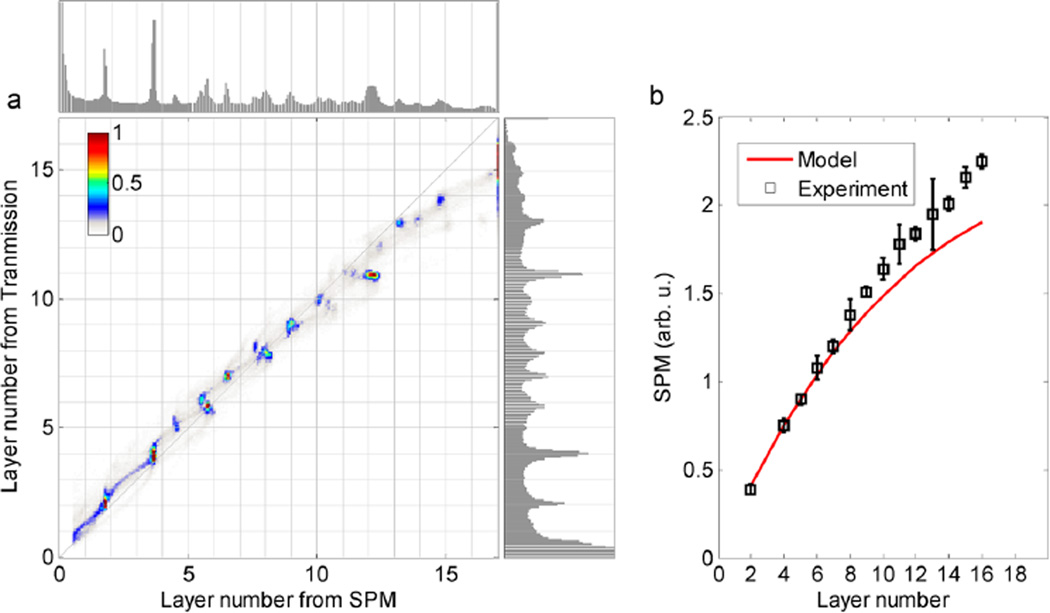
Figure 3.
Comparison of graphene flake layer counting by transmission or nonlinear contrast. (a) Top (right) panel plots the histogram of number of layers converted from SPM (transmission) contrast in Figure S6. The major panel plots the 2D histogram of the number of layers, where the contributions from blank areas are masked. (b) SPM signal as a function of number of graphene layers. The red curve plots the scaling model NS/(1 + NS)5 with S obtained by fitting the small-layer transmission data.

