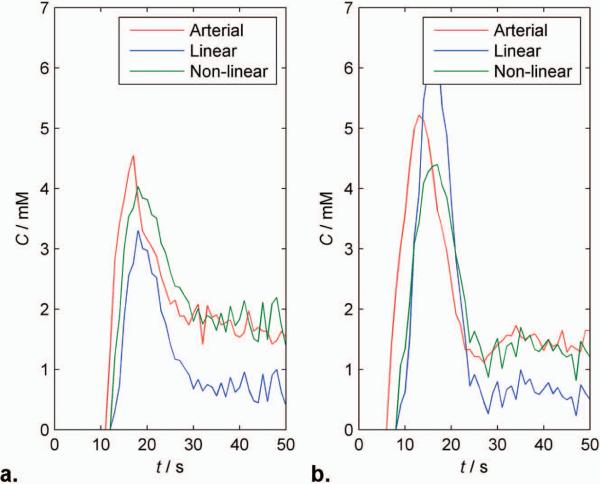
FIG. 4.
Plots of estimated blood contrast agent concentration from a single patient at a) 1.5T and b) 3T. The concentration estimates were obtained from signals in arteries (red line), white matter using the linear (blue line) and non-linear (green line) formulations. The arterial and white matter concentrations calculated using the non-linear formulation is in excellent agreement when considering delay and dispersion.

