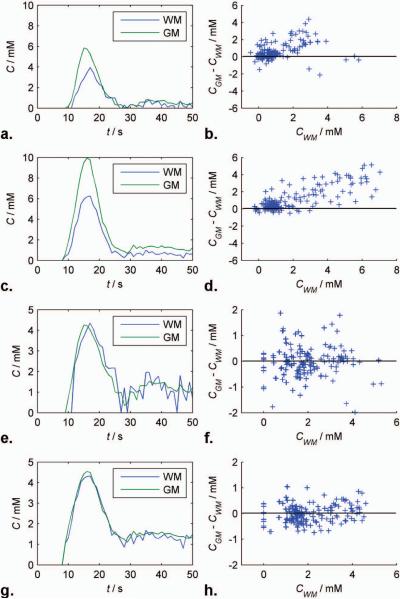
FIG. 6.
Blood concentration-time curves in WM (blue) and GM (green) from a single test patient calculated using linear and non-linear formulations at 1.5T (Figs. 6a and e) and 3T (Figs. 6c and g), respectively. Differences between scaled GM and WM curves from the beginning of the bolus to 30 seconds after are plotted against WM concentration over all test patients at using linear and non-linear formulations at 1.5T (Fig. 6b and f) and 3T (Fig. 6d and f), respectively.

