
Figure 3. ROCK activity in SLE patients versus healthy controls.
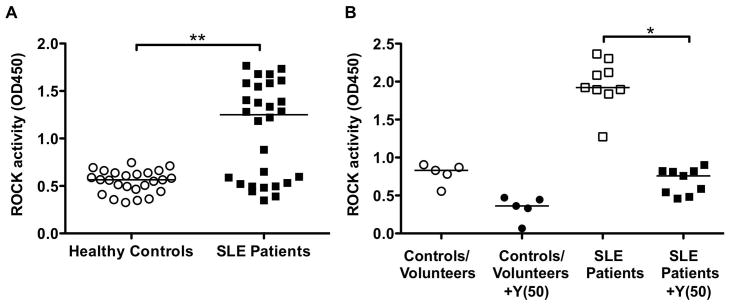
(A) PBMCs were obtained from heparinized blood samples of 28 SLE patients and 25 matched healthy controls. Whole cell extracts were prepared and ROCK activation assessed by an ELISA-based ROCK kinase activity assay. Data were analyzed by Mann-Whitney test; **p=0.0015. (B) ROCK activity in the presence or absence of Y-27632 (50 μM) from healthy controls/volunteers and SLE patients. Data were analyzed by Kruskal-Wallis with Dunn’s post test analysis; *p<0.05. Horizontal bars represent medians. Y(50): 50μM Y-27632.