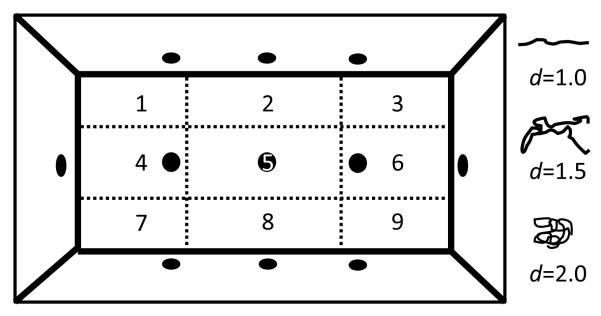
Figure 1. Schematic of the mouse Behavioral Pattern Monitor.
The arena was divided into nine unequal regions (1 – 9) on which transitions, center time, center duration, and the coefficient of variation calculations are based. The quantifiable measure spatial d was used to describe the subject’s pattern of movement with values represented in the schematic. The location of the mouse was obtained from a grid of infrared photobeams (24 × 12 X-Y array) located 1 cm above the floor. Another set of 16 photobeams located 2.5 cm above the floor on the Y-axis only was used to detect rearing behavior. The chamber is equipped with three floor holes and eight wall holes (1.2 cm diameter), each containing an infrared photobeam to detect holepoking behavior.

