
Figure 4.
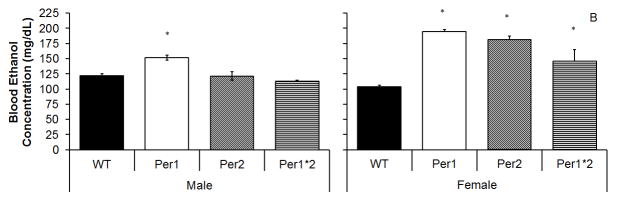
Genotype differences in blood alcohol concentration. A) In males, on mPer1 mice showed a significantly higher blood alcohol concentration than WT mice. B) In females, all mPer mice showed higher blood alcohol levels than WT mice (Mean ± SEM; * indicates significant differences between from WTs at p<0.05).