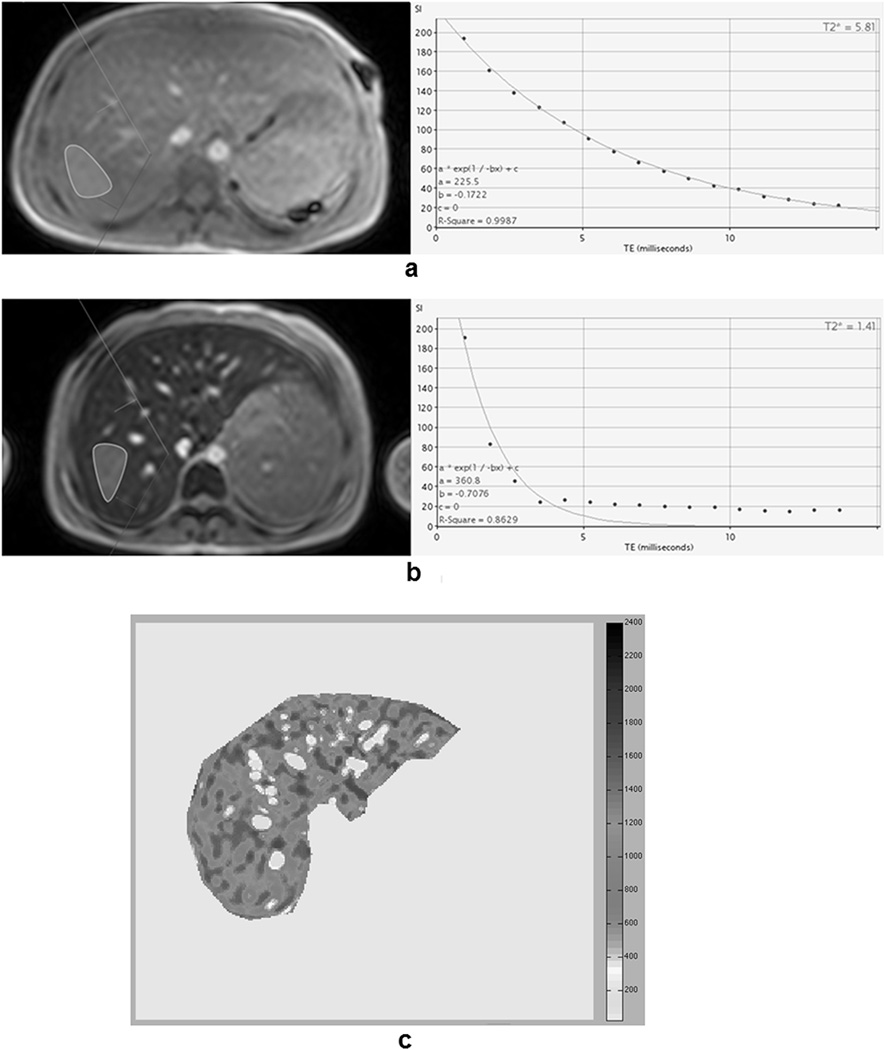
Figure 1.
a) and b) Screenshot of CMRtools software (region of interest definition in the left and signal decay fitting in the right) for a patient with moderate iron overload and for a patient with severe iron overload, respectively. For the patient with severe iron overload, the single-exponential model was not able to compensate the signal offset. In order to obtain an optimal fitting (R-square > 0.99), the last echo times (TEs) were excluded by de-selecting them. The final T2* was 1.05 ms, corresponding to a R2* of 952.4 Hz and a liver iron concentration (LIC) of 29.3 mg/g/dw. c) R2* map obtained with the Wood’s approach for the same patient in Figure 1b. The mean R2* for this distribution was 1087.9 Hz, corresponding to a LIC of 29.5 mg/g/dw.

