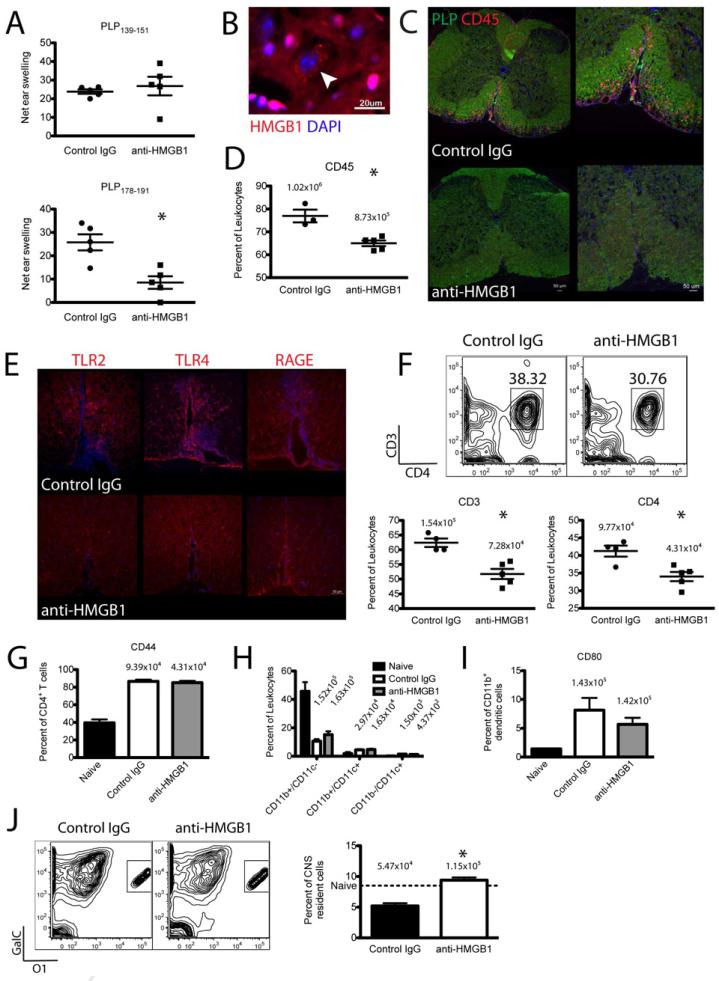
Figure 3. HMGB1 neutralization inhibits T cell infiltration and activation early after treatment.
R-EAE was induced in SJL/J mice by immunization with 50 μg PLP139-151/CFA s.c. and 100 μg anti-HMGB1 neutralizing antibody or isotype control antibody was injected i.v. at disease remission (day 19 p.i.). PLP139-151- and PLP178-191-specific CD4+ T cell responses were assessed by DTH assays five days later (A). Spinal cords were harvested for immunohistochemical or flow cytometric analysis seven days after antibody injection (26 days p.i.). For IHC, 8 μm-thick coronal sections were cut from fixed tissue, mounted onto slides, and stained for HMGB1 with DAPI counterstaining (B); PLP and CD45 (C); and TLR2, TLR4, and RAGE (E). Fluorescent images were acquired at ×10 (C-left panels) and ×20 magnification (B,C-right panels, E). HMGB1 was found in a majority of cells in the CNS localized to the nucleus with a few cells expressing cytoplasmic HMGB1 (B, arrowhead). Anti-HMGB1-treated mice showed less CD45+ immune cell infiltration (C) and less TLR2 and TLR4 expression (E) in the PLP-rich white matter of the ventral spinal cord than control-treated mice. For flow cytometry, spinal cords were dissociated, single cells were purified, and cells were stained for CD45 to distinguish resident CNS cells from immune infiltrates (D). T cells were stained for CD3, CD4, and CD44 expression (F,G), APCs were stained for CD11b, CD11c, and CD80 expression (H,I), and mature oligodendrocytes were stained for GalC and O1 expression (J). Data are representative of two experiments of ≥ 5 mice per group. Back-calculated absolute cell numbers are indicated in plots above data points. Asterisks denote a significant difference in DTH responses or flow cytometric quantification between treatment groups by Student's t-tests (p < 0.05).

