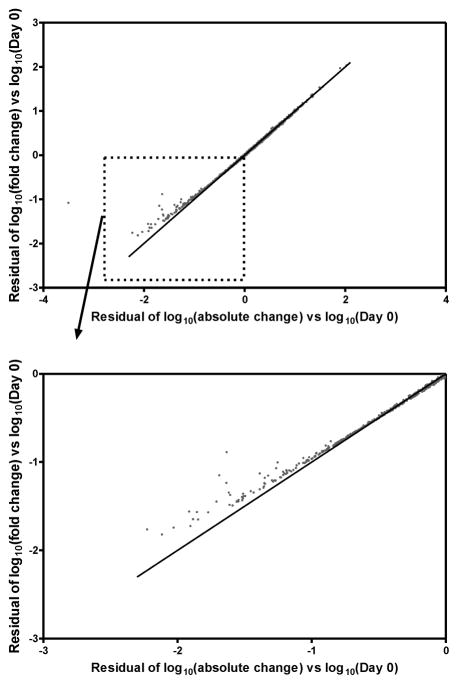
Figure 3.
Residuals for Day 0 adjusted models: log10(fold change) model versus log10(absolute change) model. (A) All data points. Note that for the majority of values, the two residual values are very similar, only diverging from the line of equality at very low values (e.g., less than −1.0). (B) Subset of data points with residuals less than 0.

