
Fig. 3.
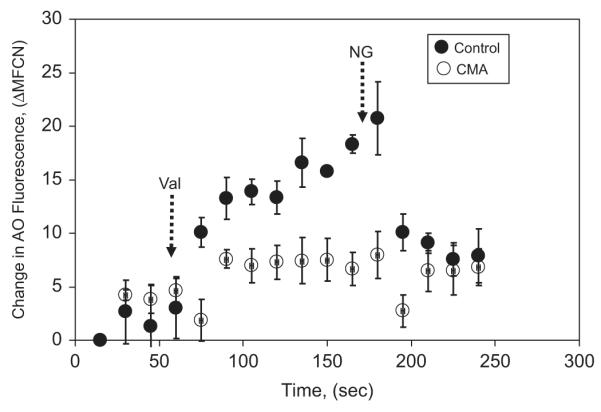
Acidification of PM-PLS as measured by acridine orange (AO) uptake by flow cytometry. The PM-PLS were prepared from neutrophils isolated with Ringer’s buffer and lysed in the relaxation buffer containing protease inhibitors. Fifty microliters of the isolated PM-PLS was diluted into 0.5 ml of the chloride-rich (100 mM KCl) relaxation buffer with 1 mM ATP and 4 μM AO for 1 min and then analyzed by flow cytometry at 15-s intervals at room temperature. After the AO fluorescence associated with the monomeric particle population stabilized, valinomycin (Val; 1 μM; left dashed arrow) was added, which increased the degree of acidification over time significantly (solid circles). Addition of 7 μM nigericin (NG; right dashed arrow), which would be expected to equilibrate the PM-PLS luminal pH to the extraphagosomal pH (7.0) by exchanging extraphagosomal potassium ions for intraphagosomal protons, quenched the fluorescence associated with the PM-PLS. Inclusion of 500 nM concanamycin A (CMA) in the system blocked the valinomycin-dependent acidification response (open circles). Vertical bars represent the standard deviation of the mean of triplicate runs.