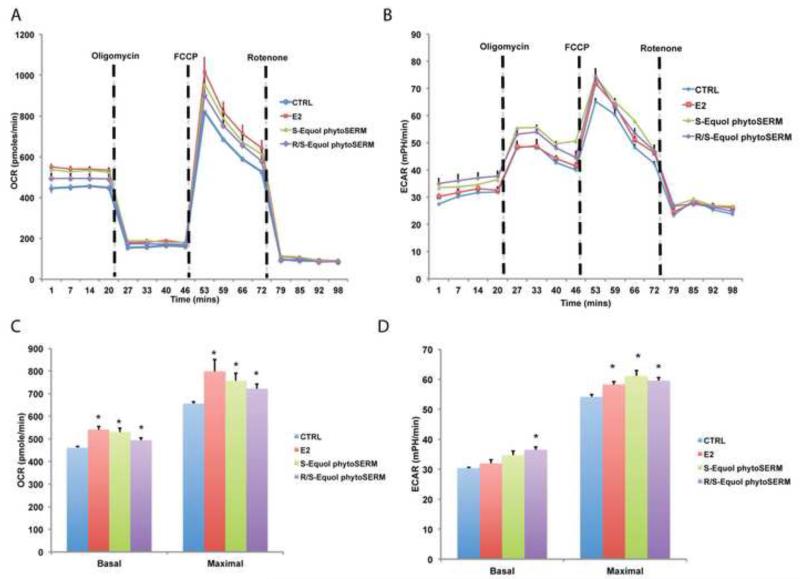
Figure 1. Both S-equol phytoSERM and R/S-equol phytoSERM combination treatments promotes mitochondrial bioenergetics in vitro.
Primary hippocampal neurons were treated with S-equol phytoSERM combination (100 nM), R/S-equol phytoSERM combination (100 nM), E2 (10 nM), or vehicle for 24 hours. Cellular metabolic flux activity was measured using the Seahorse metabolic analyzer. A&C, Both E2 (Red), S-equol phytoSERM (green), and R/S-equol phytoSERM (purple), increased the basal respiration and maximal mitochondrial respiratory capacity (indicated by OCR, Oxygen consumption Rate) relative to vehicle control (blue). A, representative OCR VS Time curve; C, bar graphs of basal and maximal mitochondrial respiration (*, p<0.05 compared to vehicle group, n=5 per group). B&D, R/S-equol phytoSERM (purple) combination increased the basal aerobic glycolysis (indicated by ECAR, Extracellular Acidification Rate), while E2 (Red), S-equol phytoSERM (green), and R/S-equol phytoSERM (purple), increased the maximal aerobic glycolysis rate. B, representative ECAR VS Time curve; D, bar graphs of basal and maximal aerobic glycolysis (*, p<0.05 compared to vehicle group, n=5 per group).

