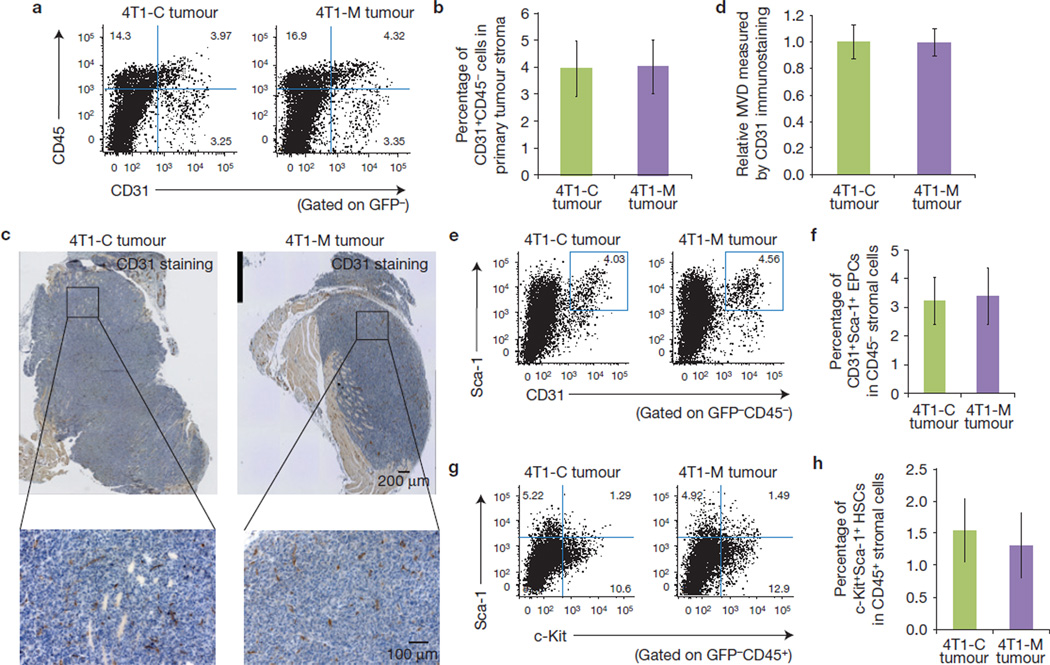
Figure 4.
miR-126/miR-126* do not suppress tumour angiogenesis or the recruitment of HSCs and EPCs. (a) Fluorescence-activated cell sorting (FACS) analysis of tumours showing the proportion of CD45−CD31+ endothelial cells inside the GFP− tumour-associated stroma. (b) Quantification of the percentage of endothelial cells in 4T1-C and 4T1-M tumour stroma. Error bars represent mean±s.d. collected from three independent experiments. P > 0.1 by Student’s t-test, indicating no statistical significance. (c) Representative CD31 immunostaining of 4T1-C- and 4T1-M-initiated tumours. Scale bars, 200 µm (upper panels) and 100 µm (lower panels). (d) Relative microvascular density (MVD) determined by CD31 staining. Five random fields in each tumour were counted for MVD. Error bars represent mean±s.d. from three independent experiments. P > 0.1 by Student’s t-test, indicating no statistical significance. (e) FACS analysis of tumours showing the proportion of CD31+Sca-1+ EPCs inside the GFP− tumour-associated stroma. (f) Quantification of the percentage of EPCs in 4T1-C and 4T1-M tumour stroma. Error bars represent mean±s.d. collected from three independent experiments. P > 0.1 by Student’s t-test, indicating no statistical significance. (g) FACS analysis of tumours showing the proportion of CD45+Sca-1+c-Kit+ HSCs inside the GFP− tumour-associated stroma. (h) Quantification of the percentage of HSCs in 4T1-C and 4T1-M tumours. Error bars represent mean±s.d. collected from three independent experiments. P > 0.1 by Student’s t-test, indicating no statistical significance.

