Figure 3.
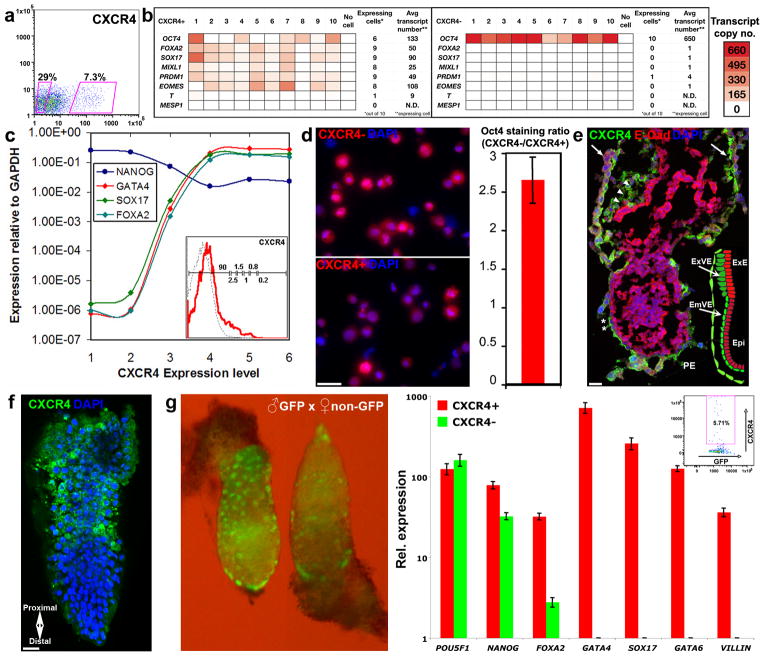
Primitive endoderm characteristics of CXCR4+ cells representing progenitor group no. 1. (a) Gates for sorting CXCR4+ and CXCR4− cells from CM-treated 3-day cultures. (b) Representative analysis of differentiation and pluripotency genes in ten single CXCR4+ (left) and CXCR4− cells (right) sorted from CM-treated cultures. Transcript copy numbers of GAPDH and OCT4 in single CXCR4− cells were determined by “Digital PCR”. Copy numbers of the remaining genes (displayed as red color-coded sectors) were estimated based on the respective difference in qRT-PCR cycles between each gene and GAPDH (used as a reference gene). Genes were said to be “expressed” if their estimated transcript number exceeded 2 copies per cell. “N.D.” denotes undetectable levels. (c) Analysis of endoderm (SOX17, FOXA2, GATA4) and pluripotency (NANOG) genes in single cells fractionated by six sorting gates along the intensity axis of CXCR4 (averaged across 4–7 cells in each group, CM-treated cells). Inset displays the histogram of CXCR4 levels with the respective sorting gates (1 through 6). (d) Immunohistochemistry of OCT4 protein in CXCR4− (top) and CXCR4+ cells (bottom) sorted from CM-treated cultures. Quantitative analysis of staining intensity across 10 fields of single cells revealed ~2.7-fold higher OCT4 levels in CXCR4− relative to CXCR4+ cells (right), confirming moderate reduction in the level of pluripotency factors in single CXCR4+ cells. (e) Immunohistochemistry of Cxcr4 (green) and E-cadherin (red) in E6.5 mouse embryos. Note the staining of cells within primitive endoderm tissues, including the parietal endoderm (arrows), and the extra embryonic and embryonic portions of the visceral endoderm (arrowheads and asterisks, respectively). E-cadherin staining was confined to the epiblast. Inset diagram shows the locations of anterior primitive endoderm and epiblast in E6.5 mouse embryos. (f) Whole mount immunohistochemical analysis of Cxcr4 (green) in E6.5 mouse epiblast revealed membrane staining at the extra embryonic proximal region. DAPI staining is shown in blue. Scale bars = 25 μm. (g) Left: GFP+ E6.5 mouse embryos produced by mating C57BL6/Ka GFP males with C57BL6/Ka Wt females. Right: Relative expression of pluripotency and endoderm genes measured by qRT-PCR in single sorted (inset) GFP+Cxcr4+ and GFP+Cxcr4− cells (averaged across 2–8 cells). Error bars represent s.e.m.

