
Figure 4.
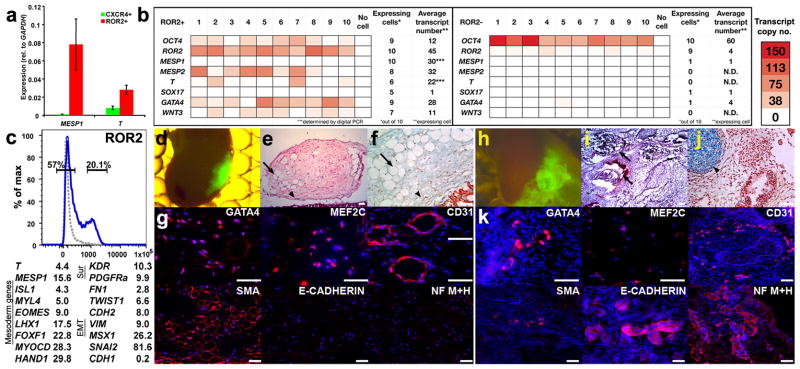
ROR2+ progenitors (representing group no. 2) exhibit characteristics of embryonic mesoderm and generate mesoderm tissues in vivo. (a) Levels of the mesoderm genes, MESP1 and T, in ROR2+ versus CXCR4+ progenitors sorted, respectively, from BMP4-treated and CM-treated cultures. Error bars represent s.e.m. (b) Representative analysis of differentiation and pluripotency genes in ten single ROR2+ (left) and ROR2− cells (right) sorted from 3-day BMP4-treated embryoid bodies. Transcript copy number of GAPDH was determined by Digital PCR. Copy numbers of the remaining genes (displayed as red color-coded sectors) were estimated based on the respective difference in qRT-PCR cycles between each gene and GAPDH. Genes were said to be “expressed” if their estimated transcript number exceeded 2 per cell. (***) Average copy numbers of T and MESP1 in ROR2+ cells were determined based on single cell measurements using Digital PCR. “N.D.” denotes undetectable levels. (c, top) Gating strategy for sorting ROR2+ and ROR2− cells from 3-day BMP4-treated cultures (isotype control shown as gray dotted line). (c, bottom) Expression fold-difference of representative mesoderm, lateral mesoderm, and epithelial-to-mesenchymal transition (EMT) genes in ROR2+ versus ROR2− populations that were cultured for 7 more days in the presence of FBS (based on an average of two genome-wide profiling experiments conducted with cultures at different passages). (d,h) Ectopic cell masses formed by sorted GFP-labeled ROR2+ (d) and ROR2− cells (h) 8 weeks following sub-capsular renal transplantation. (e,i) Low-power microphotographs of Hematoxylin and Eosin (H&E) stained ROR2+ (e) and ROR2− graft sections (i). (f,j) High magnification microphotographs of pentachrome-stained sections from ROR2+ (f) and ROR2− grafts (j). Light blue denotes heparan sulfate–rich region. Intense blue corresponds to cartilage. (e,f) ROR2+ grafts contained numerous vascular (arrows) and mesenchyme structures (arrowheads) with no evidence of epithelium, cartilage, or ossification. (h–j) ROR2− grafts were substantially larger (h) and contained epithelial structures (arrows, i) and cartilage (arrowheads, j). (g) Positive immunostaining of large portions of ROR2+ grafts with a panel of antibodies recognizing the mesoderm markers, GATA4, myocyte-specific enhancer factor 2C (MEF2C), platelet endothelial cell adhesion molecule (PECAM1, CD31) and smooth muscle actin (SMA). In contrast, the neuronal markers (medium and heavy neurofilament chains; NF M+H) and the epithelial marker, E-cadherin, were not detected in these grafts. (k) Similar analysis in ROR2− grafts revealed GATA4 and MEF2C staining only in a small number of cells. Likewise, CD31 and SMA were expressed in localized regions in the ROR2− graft. In contrast, NF M+H and E-cadherin were widely expressed. DAPI staining of DNA is show in blue. Scale bars, 25 μm.