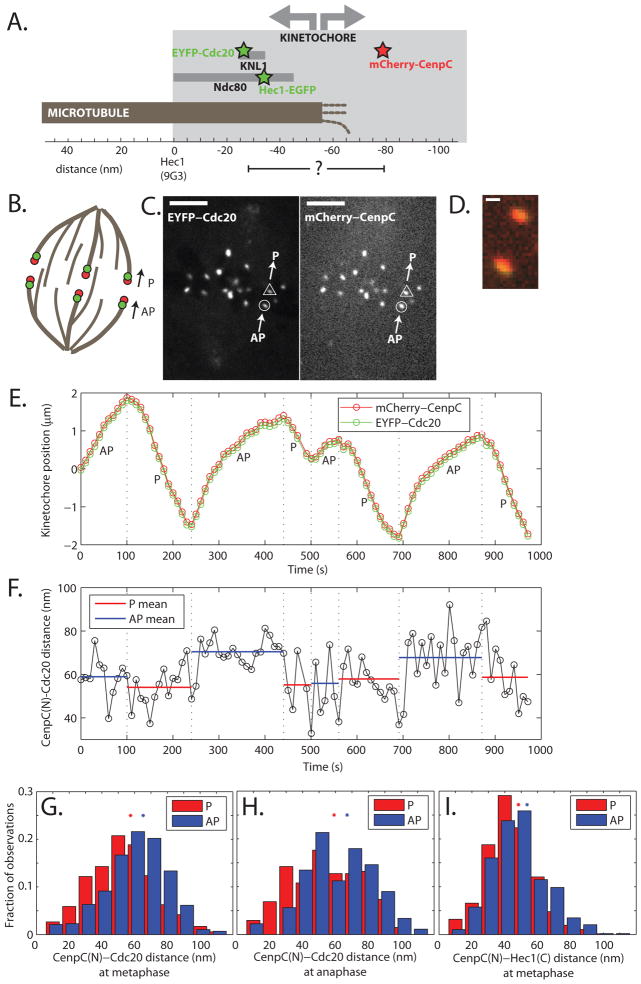
Fig. 1.
Tracking kinetochore probe pairs. (A) Simplified one-dimensional representation of kinetochore organization (6) with probe positions indicated by stars. (B) Experimental schematic. Kinetochore positions oscillate during metaphase. P denotes movement towards a pole, AP movement away. Probes are indicated as colored circles. (C) Representative images of EYFP-Cdc20 and mCherry-CenpC at one time point. Bar = 5 μm. (D) Enlarged image of the single kinetochore pair indentified in (C). Bar = 500 nm. (E) Representative tracks of a single kinetochore (circle-identified in (C)) with direction indicated. Dashed lines = direction reversals. (F) Inter-probe distance versus time from the tracks in (E). Dotted lines = reversal times. (G, H) Histograms of all CenpC(N)-Cdc20 distance measurements during metaphase (G) and anaphase (H) anaphase. The average of the means of P and AP distributions is consistent with reported CenpC-KNL1 N-terminal distance in fixed cells (53–54 nm (6, 17)). (I) Histograms of all CenpC(N)-Hec1(C) distance measurements during metaphase. The noise in single traces and histogram widths (F–I) stemmed from both experimental noise (e.g. centroid determination and two color registration) and biological variation. Stars = histogram distribution means.

