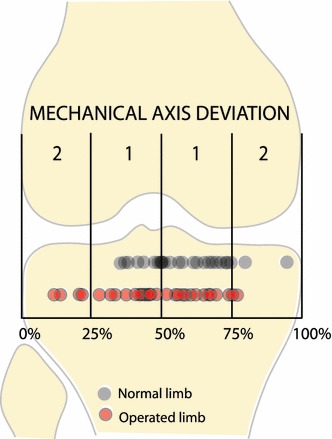
Fig. 4.

The scatter diagram depicting the mechanical axis deviation of the 33 operated limbs and the contralateral normal limbs is superimposed on the diagram of the knee with the zones marked. The vast majority of values of the operated limbs fall within zone 1
